Assorted Rants, Rumblings and Ruminations from the Mind of a “So-Called” Expert

- Details
- Written by: Todd Zola
- Category: Organized Chaos
This is part of part of the Z-Book, an ongoing compilation of new and refreshed pieces. It's part of the 2020 Mastersball Platinum subscription, available for just $39.95, featuring the industry's earliest and most comprehensive set of player projections.
You’re going for a walk in the park and spot a lamp on a bench. You pick it up and rub it and a genie emerges, granting you one wish. You ask for the final MLB stats of everyone appearing in 2020. The genie says that’s too much. Instead, you can choose the slash line of all the hitters and the ratios for the pitchers or the number of plate appearances and innings pitched for everyone. Which do you choose?
An argument can be made for both. Choosing the slash/ratios indirectly hints at playing time. If the player’s numbers are good, they’re going to play and vice versa. Though, you won’t know if the player missed a significant portion of the season. Choosing the playing time covers the injury aspect, and hints at how well the guy played. More playing time than usual suggests better outcomes than expected. That said, you’re going to miss some big skills improvement from those already expected to play a lot.
Personally, the choice is clear. Give me the playing time. I’ll trade the Lucas Giolito breakout for knowing Giancarlo Stanton misses the entire season. Seeing Chris Paddack will throw 140.2 IP tells me he impressed in the spring and was able to maintain it over the season. After making the genie pinky-swear he wasn’t pulling my leg on Hyun-Jin Ryu’s 182.2 IP, I’d assume he pitched to his usual high level for essentially the full season.
I’ve been saying this for years. Doing your own projections is tedious and laborious. Unless you run a small business with projections as a major product, it’s, dare I write, unnecessary. The skills/production element of most sources are close. What differs is playing time. You want to do your own projections? Find a trusted source or two and season with your own playing time expectations. Voila, you have your own projections.
It’s my strong belief in the importance of playing time driving the diligence going into the Mastersball Platinum projections. Unfortunately, I haven’t gone for a walk in a park for a while, let alone happened upon a magic lamp. Plus, my crystal ball broke years ago and the replacement is still on back order.
What follows is a discussion of how I derive plate appearances and innings pitched. The actual mechanism is straightforward and will be detailed later. The more relevant talking points are my overall philosophy as it has matured over the years, differing greatly from when I first started doing this.
There was a time I chided projections systems over-projecting playing time, or not having the aggregate hits and runs from batters nearly match those given up by pitchers. It made perfect logical sense to me and I’m not going to admonish anyone still feeling that way. However, I am going to try to convince you it’s impractical, and a detriment to fantasy baseball prep.
The bottom line is, I can’t project injuries. Sure, there are some players with a health history warranting accounting for it in projections, but that’s only a piece of the injury pie. There are some players you just know are going to get 350-400 plate appearances. You don’t know when or where, they just are. I call this the Ty Wigginton rule. In order to make a team’s ledger balance, playing time must be taken away from some to allow the Ty Wiggintons to get theirs. Over time, I’ve learned this is counterproductive. I don’t know who is going to get hurt, or slump, but someone is and Wigginton is going to play. Taking playing time from a starter to make the math work unjustly lowers his ranking. I’d rather give Wigginton his portion and over project the rest. It renders a more practical projection set to build a team.
The same principle carries over for pitching. There are some swingmen virtually assured of some starts. It’s necessary to get a feel for how they’d perform, even if it means projecting 172 starts for the team. Shortchanging the starting five by two each unfairly lowers their innings, affecting their rank.
In full disclosure, playing early draft and hold leagues was the impetus for this change in approach. For those unaware, these are leagues with no in-season pickups by FAAB or waivers. The most common format is the National Fantasy Baseball Championship Draft Champions, with 15 teams and 50 roster spots. Fantrax also offers a similar setup. The point is, once you get into the second half of the draft, you’re drafting a lot of reserves, so it helps to have a practical sense of their potential contributions.
At this point, it’s fair to wonder if the playing time is more logical closer to the season. Yes and no. I’ll continue to include allowances for Ty Wigginton and his friends, but as some teams’ scenarios clear up, adjustments will be made. That is, I try to use common sense. Early on, it’s clear some teams have too many players for a spot while others are lacking. With respect to the former, if in my best judgment a player is going to be traded, I’ll project him for the playing time he’s likely to get on another team. Obviously, this is a guess, who knows what team, the role and the venue, but I’d rather do this than deprive the player of plate appearances, so his ranking is such he isn’t on the radar in Draft and Hold leagues. On the flip side, if it’s probable a team will bring someone else in for a position, I won’t force a player into that playing time. As opening day draws closer and either of these scenarios remain, I’ll do a mea culpa and assign playing time with the internal options.
The other point to discuss isn’t so much philosophy as it is mindset. When determining playing time, we tend to be optimistic for players we like, often younger, more established players. Not only are the rate stats aggressive, so is the volume. To help keep everything in perspective, here’s a refresh of a study I run every few years. I didn’t do the associated pitching version yet; look for that down the line.
The concept is looking at how many plate appearances batters within specified ranges garner the following season. To be eligible for the study, hitters needed consecutive seasons over 200 plate appearances. The following season’s result is classified as follows:
- 10 percent-plus more
- 5 to 10 percent more
- 5 to 7.5 percent more
- 5 to 5 percent more
- 5 percent less to 2.5 percent more (defined as the same)
- 5 to 5 percent less
- 5 to 7.5 percent less
- 5-10 percent less
- 10 percent-plus less
Eligible players are grouped in ranges of 25 plate appearances with the final one being 676-plus. The percentage of players falling within each of the above classifications is calculated. The study goes back to the 2015 season, so there’s four years of trials incorporated (2018-2019, 2017-2018, 2016-2017 and 2015-2016).
Before posting the results of the study, here's a table displaying the number of hitters in each playing time range. Please note some did not get included in the study if they didn't accrue over 200 plate appearances the ensuing campaign.
| PA | 2019 | 2018 | 2017 | 2016 | 2015 |
| 676+ | 21 | 23 | 19 | 33 | 20 |
| 651-675 | 20 | 13 | 16 | 14 | 24 |
| 626-650 | 12 | 15 | 25 | 24 | 14 |
| 601-625 | 16 | 20 | 17 | 17 | 23 |
| 576-600 | 15 | 22 | 13 | 16 | 12 |
| 551-575 | 11 | 14 | 18 | 12 | 17 |
| 526-550 | 23 | 17 | 23 | 18 | 13 |
| 501-525 | 17 | 20 | 13 | 12 | 20 |
| 476-500 | 21 | 15 | 23 | 11 | 15 |
| 451-475 | 13 | 24 | 13 | 17 | 18 |
| 426-450 | 15 | 18 | 19 | 20 | 20 |
| 401-425 | 23 | 13 | 17 | 9 | 15 |
| 376-400 | 11 | 15 | 13 | 12 | 18 |
| 351-375 | 23 | 18 | 18 | 17 | 18 |
| 326-350 | 22 | 16 | 17 | 20 | 7 |
| 301-325 | 10 | 15 | 23 | 15 | 14 |
| 276-300 | 28 | 16 | 12 | 20 | 14 |
| 251-275 | 18 | 17 | 18 | 20 | 29 |
| 226-250 | 27 | 19 | 13 | 20 | 18 |
| 201-225 | 14 | 24 | 17 | 25 | 22 |
Here is the table showing how qualifed batters ended up the next season.
RED: Percent fewer plate appearances
Yellow: Same plate appearances
GREEN: Percent more plate appearances
| PA | -10+ | -10 to -.7.5 | -7.5 to -5 | -5 to -2.5 | -2.5 to 2.5 | 2.5 to 5 | 5 to 7.5 | 7.5 to 10 | 10+ |
| 676+ | 35.9% | 7.6% | 7.6% | 10.9% | 29.3% | 6.5% | 2.2% | 0.0% | 0.0% |
| 651-675 | 41.5% | 6.2% | 3.1% | 7.7% | 24.6% | 7.7% | 6.2% | 1.5% | 1.5% |
| 626-650 | 42.1% | 5.3% | 5.3% | 7.9% | 13.2% | 10.5% | 6.6% | 3.9% | 5.3% |
| 601-625 | 52.1% | 4.1% | 5.5% | 4.1% | 15.1% | 6.8% | 4.1% | 4.1% | 4.1% |
| 576-600 | 46.6% | 5.2% | 3.4% | 5.2% | 5.2% | 6.9% | 8.6% | 6.9% | 12.1% |
| 551-575 | 50.0% | 0.0% | 0.0% | 3.7% | 9.3% | 5.6% | 5.6% | 5.6% | 20.4% |
| 526-550 | 42.6% | 8.2% | 3.3% | 0.0% | 9.8% | 3.3% | 3.3% | 11.5% | 18.0% |
| 501-525 | 38.8% | 0.0% | 4.1% | 4.1% | 12.2% | 6.1% | 6.1% | 0.0% | 28.6% |
| 476-500 | 33.9% | 3.6% | 5.4% | 5.4% | 7.1% | 5.4% | 1.8% | 7.1% | 30.4% |
| 451-475 | 39.3% | 1.6% | 3.3% | 3.3% | 11.5% | 4.9% | 3.3% | 3.3% | 29.5% |
| 426-450 | 28.8% | 0.0% | 3.0% | 3.0% | 6.1% | 3.0% | 3.0% | 3.0% | 50.0% |
| 401-425 | 40.0% | 2.5% | 2.5% | 0.0% | 7.5% | 2.5% | 2.5% | 0.0% | 42.5% |
| 376-400 | 32.6% | 0.0% | 4.7% | 2.3% | 0.0% | 2.3% | 2.3% | 4.7% | 51.2% |
| 351-375 | 29.8% | 6.4% | 2.1% | 2.1% | 4.3% | 2.1% | 0.0% | 0.0% | 53.2% |
| 326-350 | 18.6% | 4.7% | 2.3% | 2.3% | 4.7% | 2.3% | 4.7% | 2.3% | 58.1% |
| 301-325 | 15.8% | 0.0% | 2.6% | 5.3% | 2.6% | 2.6% | 5.3% | 2.6% | 63.2% |
| 276-300 | 15.2% | 3.0% | 3.0% | 0.0% | 3.0% | 9.1% | 3.0% | 3.0% | 60.6% |
| 251-275 | 10.8% | 8.1% | 2.7% | 0.0% | 2.7% | 5.4% | 5.4% | 0.0% | 64.9% |
| 226-250 | 6.1% | 0.0% | 3.0% | 3.0% | 3.0% | 0.0% | 3.0% | 0.0% | 81.8% |
| 201-225 | 0.0% | 0.0% | 0.0% | 4.8% | 0.0% | 0.0% | 4.8% | 2.4% | 88.1% |
Before reviewing the data, this isn’t mean to be anything more than a guideline. The results are not factored into projections to have last season’s playing time match this. That said, it does offer a good overview.
To that end, there’s a flaw in the data that I should have had the foresight to consider, but it doesn’t affect the analysis. The plate appearances are not normalized for the offensive environment. That is, more runs were scored in 2019 than ever before. It stands to reason the aggregate plate appearances were also an all-time high. Batters playing the same number of games the past two seasons had more trips to the dish last year, assuming they maintained their spot in the batting order. Again, while this is a bug, it doesn’t alter the observations.
The biggest takeaway, especially at the top, is batters are much more likely to incur a decline in playing time, often a large one. For what it’s worth, this held true last season, despite the increase in runs. Between a quarter and a third of the highest volume players repeat the previous season’s plate appearances while just a handful enjoy more. If you expect more than seven or eight of the players eclipsing 676 plate appearances last season to repeat, you’re too aggressive. If you have more than two or three with increased playing time, you are way to optimistic.
The elegance of studies like this is everyone can interpret the data in their own manner. I’ll talk about other applications for the Platinum subscribers down the line.
With that as a backdrop, here is the Mastersball process for projecting playing time.
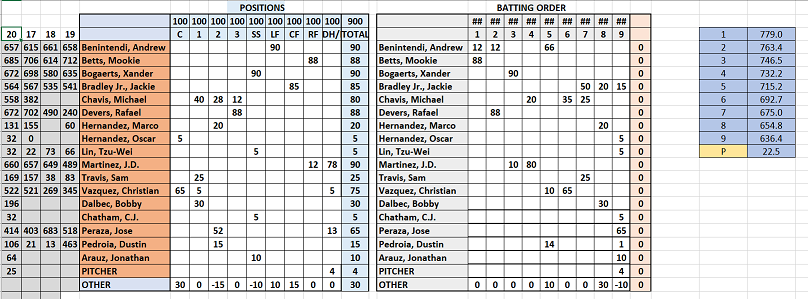
Two side-by-side grids are set up. The first projects the percent of time each player spends at a position. The second projects the percent each hits in that spot in the order. It’s the latter driving playing time.
A target number of plate appearances for each spot in the order for every team is determined from the last three years. By means of example, if the target for the leadoff spot is 753 PA and a player is projected to hit in the top spot 90% of the time, his PA are 753 x .9 or 678 PA.
Players can be projected to hit in multiple spots, Excel takes care of the dirty work. I set the sheet up to make sure the first balances with the second, as well as highlighting overages and insufficient playing time. The elegance is in its simplicity. Even though I eschewed overall logic earlier, each individual player is quite logical. The San Francisco Giants leadoff hitter projected to receive 90% of the plate appearances won’t get as many as a similar guy from the Houston Astros or New York Yankees.
Here's a typical team, the current grid for the Boston Red Sox:
In brief, pitching is done in a similar manner, though only one grid is needed. The projected innings per start is determined, then the number of starts are projected, resulting in the innings estimate. As discussed, the goal is 162 starts, but it's not forced. Innings for relievers are projected by hand.
There you have it friends, the Mastersball playing time projection process. I take pride in updating it weekly, perhaps more when required. As always, I'm happy to address any questions, preferably on the site forum.
Todd Zola is the Primary Owner and Lead Content Provider for Mastersball. He’s the defending Great Fantasy Baseball Invitational champion, besting 314 of the industry’s finest. Todd is a former Tout Wars and LABR champion as well as a multi-time NFBC league winner.
- Details
- Written by: Todd Zola
- Category: Organized Chaos
This is part of part of the Z-Book, an ongoing compilation of new and refreshed pieces. It's part of the 2020 Mastersball Platinum subscription, available for just $39.95, featuring the industry's earliest and most comprehensive set of player projections.
Statcast data and some very clever colleagues have fueled several improvements in the manner Mastersball projects batters and pitchers. Here is the detailed description of the hitting process, coined The Hitting Zystem.
1. Convert major league performance to neutral
Aging curves and park factors are applied. Aging is applied to all skills while the following are subject to park factors:
• Hits*
• Doubles*
• Triples*
• Homers*
• Strikeouts
• Walks
• RBI
• Runs
*Distinguished for left-handed, right-handed and switch hitters
Neutralized singles are neutralized hits minus neutralized doubles, triples and homers.
The stats for a specific season are neutralized via the indices for that season. This is opposed to using a three-year average (which will be incorporated later). I’ve run the numbers both ways, using the associated season and the current three-year average and prefer the former. However, there are occasional instances where a player changes teams and there’s an extreme in park factors on one of the two clubs skewing translations where some personal massaging is necessary. When the player is on the same team all three years, the extreme factor is baked into the three-year average and everything comes out in the wash.
The conventional method for park factors is taking the specific factor and averaging it with 100, then adjusting. The reason is it’s assumed a batter splits his playing time evenly home and on the road with the further presumption the aggregate away factors are 100. While the former isn’t always the case, there’s no way to predict the home and away plate appearances. However, something can be done about the aggregate away parks not always being 100. I employ composite park factors, a weighted average of every park on that team’s schedule. The composite factor doesn’t need to be averaged with 100 since home and away are already baked in. Look for a separate essay reviewing composite park factors.
All other stats (hit by pitch, sacrifice, sacrifice fly, grounded into double play) are carried through without adjustment.
2. Convert minor league performance to neutral
Way back in 1985 Baseball Abstract, Bill James first introduced the concept of the major league equivalencies (MLE). In short, an MLE translates the minor league numbers to how the player would have performed in the major leagues, exhibiting the same skill level. They’re adjusted for park, overall hitting environment and quality of competition. The skeletal process has remained the same for almost 40 years, but the conversions have been refined as the available data has improved. MLEs have good predictive value hence serve as a surrogate for MLB performance. They’re not perfect as there’s selection bias with respect to the players being good enough to make the Show, but they’re sufficiently accurate relative to the general reliability of projections.
MLEs are only trustworthy for Double-A and Triple-A, so every batter playing at those levels has his numbers translated. If he appears at both levels or is traded, the MLE for each individual team is determined.
A recent trend is for some top prospects being promoted to the major league level with just a little action in Double-A. It’s usually outstanding in nature, lest they wouldn’t have been advanced. Even with the MLE tempering the translation, these cases result in an impractical MLB projection, so I’ll sum up the numbers at the lower levels and apply the average MLEs from all the Double-A teams. It’s not perfect but its better than using a hyperbolic translation.
Foreign players are also subject to MLEs. It’s not exact, but I’ll apply the average Triple-A MLEs to those coming from Japan (Nippon Professional Baseball) while those coming from Cuba and South Korea (Korea Baseball Organization) get adjusted using Double-A MLEs.
3. Regress homers
Major league stats and MLEs are treated differently since the necessary data isn’t as accessible for the minor leagues. The described treatment is for MLB numbers.
Hat tip to Fangraphs Mike Podhorzer for this research. Home runs correlate quite well with average fly ball distance. This will be described in detail in a future site piece, but the correlation is stronger than average home run distance. It’s also stronger than adjusting both average fly ball distance and average home run distance by park factors.
The process involves using the results from qualified players and determining an expected home run level based on average fly ball distance. The players actual homers are regressed to the expected amount using regression levels discussed previously. The starting point is 50%, which is just an average of expected and actual. This is the number carried through the rest of the process.
4. Neutralized stats are summed using a weighted average
Different sources use varying number of seasons and assorted weighting. After some back-testing, it’s been decided to use three years’ worth of data, weighted 11:7:4 with 11 most recent. Each normalized stat is multiplied by the associated coefficient then the yearly results are summed and divided by the total of the applicable coefficients. For example, if the player was active all three seasons, the denominator is 22.
The weighted average is also carried out on plate appearances as well as catcher interference. The reason for the latter is the number of projected at bats is plate appearances less the sum of walks, hit by pitch, sacrifice flies, sacrifice bunts and catcher interference. It doesn’t affect many hitters, and even them most are just a couple at bats, but it helps with bookkeeping and logical checks to make sure everything is coded correctly.
5. Determine adjusted hits
The nHits determined from Step 4 need to be regressed using xBABIP (expected batting average on balls in play). This is adjusted hits.
I deployed a new procedure for xBABIP this season. Previously, I determined it by breaking batted balls into grounders, infield line drives, outfield line drives, pop-ups, bunts and fly balls. Further, each was classified into hard, medium and soft hit. The expected hits for each was calculated using the league BABIP for the respective components. The primary shortcoming is this method didn’t account for the player’s speed, so the BABIP on grounders for some is better or worse than league average.
The new method uses Statcast’s xBA (expected batting average). This is determined by comparing the exit velocity, launch angle and runner’s sprint speed of a specific batted ball to the outcome of all similar batted balls. The result is a probability of being a hit. By means of example, if a specific batted ball was deemed 79% likely to be a hit, the batter is credited with .79 hits, yielding expected hits. The caveat here is xBA is not park corrected. This is fine for the ensuing analysis since we’re working with neutralized numbers, but there are a lot of folks incorrectly using xBA (and xwOBA) as a means to identify lucky or unluck players simply by looking at the difference between xBA (or xwOBA) and they actual number. The expected number needs to be park-corrected before the comparison is made. The reason is the Statcast data is lumped together with all parks included in the comparison. A simplified example could be a certain batted ball would be a homer in Yankee Stadium 100% of the time and an out in Oracle Park 100% of the time. If these were the only two venues, and an equal number of this type of batted ball occurred in each park, the hit probability is 50%. Obviously, this is an oversimplification of what occurs within all 30 ballparks. I’m getting off on a tangent here, but a Colorado hitters wOBA should be higher than his xwOBA with a San Francisco batter should sport a wOBA lower than expected. The difference does not render the Rockies guy lucky and the Giants dude unlucky.
Getting back on point, knowing xBA, xBABIP can be extrapolated by determining the number of xHits and plugging it into the standard BABIP formula. The xBABIP for each season is determined and carried through Step 4 as its own entity.
Neutralized BABIP (nBABIP) is determined from the standard BABIP formula, using the neutralized stats from Step 4.
To get the target BABIP (tBABIP), nBABIP is regressed to xBABIP using a regression lever with the default set to 50%.
The adjusted hits are determined using the tBABIP as follows:
Adjusted hits = tBABIP x (nAB – nHR – nK + nSF) + nHR
Singles can be derived from adjusted hits by subtracting extra base hits. This isn’t perfect, it assumes all lucky/unlucky hits are singles which obviously isn’t the case, but the majority are so it serves as a viable proxy.
6. Determine RBI and Runs Index
I’ve developed an xRBI and xRuns formula using the same principle as wOBA. All the factors contributing to an RBI (single, double, triple, homer, sacrifice fly) and run (single, double, triple, homer, hit by pitch, stolen base, caught stealing) are assigned a corresponding coefficient relative in accordance with the run-scoring matrix. These coefficients use aggregate stats.
Each player has a park-adjusted number of RBI and runs calculated from Step 4, nRBI and nRuns. The respective indices are xRBI/nRBI and xRuns/nRBI.
Players on better teams often possess indices greater than one. Place in the batting order also influence the indices. Leadoff and two-hole hitters often have a run index greater than one and an RBI index less than one. Batters hitting in the meat of the order probably sport an RBI index above one.
7. Determine Stolen Base Opportunity and Success Rate
Unadjusted stats at the MLB level are used to compute the SBO (stolen base opportunity) and success rate (SB%). An MLE is applied to SB% for minor leaguers. The formula for SBO is
(singles + walks + hit by pitch)/(stolen bases + caught stealing)
8. Convert Neutral stats to Projected Stats
Some stats will be grouped together since the same operation is conducted on each. The action applied to every individual stat is multiplying the neutralized stat by the projected plate appearances then dividing by the neutralized plate appearances.
Playing time in general is worthy of its own discussion and will be reviewed in upcoming essays.
Aging is also universally applied to everything.
All results are rounded off to an integer
A. Park-corrected stats
Hits, double, triples, homers, walks and strikeouts are park-adjusted using the three-year composite average.
B. Non-park corrected stats
Hit by pitch, sacrifice, sacrifice fly, catcher interference and grounded into double play are projected without park adjustment.
C. RBI and Runs
The number of RBI and runs are projected using the aforementioned formulas then multiplied by their respective indices from Step 6.
D. Stolen bases
The number of attempts is calculated by summing projected singles, walks and HBP and multiplying by SBO from Step 7. The successful steals take that number and multiply by SB%. Caught stealing are attempts less successful tries, rounded to an integer.
E. Batting Average and Slugging Percentage
At bats are plate appearances minus the sum of walks, HBP and catcher interference.
F. On base percentage
The denominator in OBP isn’t projected PA since those include catcher interference and sacrifices. To get OBP, those need to be subtracted from projected plate appearances.
There you have it friends, the Mastersball Hitting Zystem. It's a lot to digest, so please feel free to pose questions, comments and criticisms on the message forum.
Todd Zola is the Primary Owner and Lead Content Provider for Mastersball. He’s the defending Great Fantasy Baseball Invitational champion, besting 314 of the industry’s finest. Todd is a former Tout Wars and LABR champion as well as a multi-time NFBC league winner.
- Details
- Written by: Todd Zola
- Category: Organized Chaos
One of the things I take pride in is the transparency of my methods and thought processes. Be it projection, valuation, game theory, etc., I’m an open book. Some feel it hurts my game play; maybe they’re right. It doesn’t matter. Once this became my job, be it through one of the companies I work for on a freelance basis or Mastersball subscribers, you get an honest evaluation, unbiased analysis and sincere advice, regardless if it can be used against me in a competitive nature.
Since I began doing this, I’ve publicly detailed how I generate projections and rank players. With the proliferation of new metrics and analysis, mostly Statcast but also elegant research by colleagues, I’ve improved my projections methodology. As such, it’s time to refresh the publicly facing description of the Mastersball projection process, heretofore known as The Zystem.
Truth be told, there will be multiple Zystems: projection, valuation and DFS to name a few. Call it my lame attempt at marketing.
The initial focus will be on The Projection Zystem. The rest of this essay will set the stage for the nitty gritty. Over the next week or so, the nuts and bolts regarding hitting and pitching projections will be shared.
Big picture, the Projection Zystem works as follow:
1. Convert past performance to a neutral environment
MLB players have their numbers normalized using age and park factors. Minor league players and those coming from foreign leagues are converted to an MLE (major league equivalency) which is used as a surrogate for performance.
2. Distill skills to a per plate appearance, inning pitched level
Self-explanatory, more of a bookkeeping process than anything.
3. Apply appropriate regressions
This will be one of the chief cruxes of the ensuing hitting and pitching projections methods. For the purpose of The Zystem, regression will specifically refer to elements of performance out of the player’s control as opposed to a change of skills. For example, a batter can hit a ball at a certain exit velocity and launch angle with a multitude of outcomes. The result is affected by park, weather, atmospheric conditions, men on base, etc. All the hitter controls is the manner they struck the ball.
The mechanism the adjustments are made is via regression levers. All the different levers will be detailed in future pieces, but here’s an idea how they work. In each case where regression applies, there’s an expected result. In statistical terms, it’s the mean. As mentioned, skills do not always manifest in the expected outcome. Regression is adjusting the actual outcome to the expected one. The regression levers set the extent of regression.
It’s a bit presumptuous to consider the methodology behind determining expected results as completely scientifically accurate. Think about Voros McCracken’s DIPS theory. Initially, all pitcher’s regressed to the same BABIP (batting average on balls in play). Then, this was refined to differentiate ground ball from fly ball pitchers. We’re still trying to discern the extent each pitcher controls different batted ball types and the quality of contact.
The point is the original concept of lucky/unlucky centered around how far a pitcher was from the league average BABIP. There wasn’t any accounting for a pitcher’s skill, because it couldn’t be identified. We’re still at the point where the player is driving some of the difference between actual and expected outcomes, but we're not sure to the extent.
Setting the regression lever at 100 brings the projected skill to the expected outcome. Leaving it at zero pegs the skill to the actual level. By default, the regression levels are all set at 50%. This allows subjectivity based on each individual scenario. Admittedly, this removes some objectivity, which should be a tenet of projection methodology, but it allows for personal seasoning.
Another way to look at it is expected and actual skills are a range. It’s plausible for a player to fall in between. Using 50% regression splits the difference. Overriding is a subjective determination where the player will land.
Regression levers are utilized for the following:
Hitters
- Hits
- Homers
- RBI
- Runs
- Stolen base opportunities
Pitchers
- Hits
- Homers
- Strikeouts
- Walks
- ERA
4. Determine projected skill levels using weighted average of three years’ worth of neutralized and regressed past performances
Marcels uses a three-year weighted average of 5:4:3 with 5 most recent. Based on some back-testing, The Zystem uses 11:7:4. With the tests showing the 2019 baseball was subject to reduce drag, serious consideration was given to changing so the 2019 data was weighted more than 50%. However, it was decided the 2017 ball was close enough to last year’s it served as the adjustor, with 2018 being the hedge in case the ball is changed.
5. Apply appropriate park indices
Self-explanatory, noting the following stats are park-adjusted:
- Hits
- Doubles
- Triples
- Homers
- Strikeouts
- Walks
6. Multiply by projected playing time
Self-explanatory, with the note playing time projections are even more important than skills. This is often overlooked and is usually the difference between projection sources. As such, projecting playing time deserves its own treatment thus will be included in the forthcoming essays.
There you have, an overview of the Projection Zystem. Please follow social media (@Mastersball, @toddzola on Twitter, Mastersball on Facebook) for notification when follow-up pieces are posted.
Todd Zola is the Primary Owner and Lead Content Provider for Mastersball. He’s the defending Great Fantasy Baseball Invitational champion, besting 314 of the industry’s finest. Todd is a former Tout Wars and LABR champion along with a multi-time NFBC league winner.