
- Details
- Written by: Todd Zola
- Category: Organized Chaos
And so it ends.
Seven years ago, Lawr Michaels and I merged our sites, with Lawr graciously agreeing to use the Mastersball brand. Brian Walton joined us as Managing Partners. When we went public with the merger, the overwhelming reaction was, "What took you so long?"
A few years earlier, after two years with Fantasy Planet, I rebooted Mastersball with the help of Gary Jennison, J.P. Kastner and... Lawr. Without Lawr's generous offer of sharing server space, along with freeing J.P. to build the new site, there's no way I could have gotten back in business, so to speak. A couple years later, the time was right to merge Creative Sports and Mastersball.
The seven years with Lawr and Brian, and the rest of the staff, were a supreme pleasure. I couldn't ask for a better couple of guys to work with. But, a lot happened in the ensuing seven years, both personally and professionally. Lawr talks about it in his touching farewell.
Early in the summer, I made one of the most difficult decisions ever bouncing around my gray matter.. I called Lawr and Brian and told them I needed to simplify things, saying I really need to focus on my freelance work with Rotowire and ESPN, along with a great group of loyal Platinum subscribers. Not to mention, my health. Don't worry, I'm fine. I just want to stay that way.
The best way for me to do this was to fly solo with Mastersball. After breaking the news, their response was, "What took you so long?"
You see, great as it was to be in business with Lawr and Brian, they're even better friends. Their concern wasn't the business, but me. I can't express how much that means to me. I'm not very good at this, but thanks guys!
I have no doubt Lawr will build Creativesports2 into an industry leader. i wish nothing but the best for Lawr and his staff.
More importantly, I'm forever grateful to Lawr for not only being there when I was getting back on my feet nine years ago, but for being a great friend for two decades.
And so it begins.
Today marks the first day of Mastersball as a solo entity. And, it didn't start out so great. I still have no idea why, but the system decided to auto-renew over 800 registrants, sending them a receipt for a service they didn't order. Oy vey.
If you are one of the unfortunate recipients, please accept my apologies. Trust me, Platinum is NOT on auto-renew. No one was actually charged. For that I am thankful. It was bad enough deleting over 800 memberships by hand, rebating that many PayPals would have been more tilting, not to mention embarrassing.
Anyway, things should be squared away and the first release of 2018 projections are available. If you're a Platinum 2017 subscriber, you can access then through November 14. If not, Platinum 2018 is open for business!
Plans for public facing content are still a work in progress, though I have plans for a November series featuring the playing time outlook of a team a day. Check back later for the Arizona Diamondbacks review.
in the meantime, I have a plane to catch in a few hours as I'll be joining Lawr, Brian and many others in Phoenix for the Baseball HQ sponsored First Pitch Forum.
- Details
- Written by: Todd Zola
- Category: Organized Chaos
National Fantasy Baseball Championship Cutline Primer
(Note - this was originally written a year ago, so some of the references are a little dated. They'll be updated for Platinum subscribers in early February)
New for the 2016 fantasy baseball season is a unique contest offered by our friends at the National Fantasy Baseball Championship (NFBC) called the Cutline Championship. A complete review of the rules can be found HERE.
In brief, the Cutline Championship is a points-based, best-ball scoring format. The leagues consist of ten teams and use standard NFBC roster requirements and position eligibilities. There will be an initial snake draft to fill 36 roster spots then a pair of in-season FAAB periods. The first is the week after the season starts where you can add up to five more players with the second in early June where you can add as many as you want to a maximum of 46 roster spots. The regular season ends right around the All-Star break where teams will be entered into the Cutline Finals, Consolation Round or have their season end. More teams will be eliminated over the next nine weeks until a Cutline Champion is crowned in early September.
What follows is a primer for those entering the inaugural Cutline Championship. Even though the discussion will focus on that contest, many of the principles transcend into other formats so hopefully all Platinum subscribers can glean a nugget or two to help in their draft prep.
SCORING
The Cutline scoring is designed so that the ranking of the players by points emulates the ranking via standard 5x5 rotisserie scoring. The hitter’s correlation coefficient is .99 while pitcher’s is about .90.
A noteworthy difference between the Cutline and other NFBC contests is there isn’t a Friday transaction day for hitters. The scoring period for everyone runs from Monday through Sunday.
Points are awarded as follows:
HITTING
- Home Run: 6 points
- Stolen Base: 5 points
- Hit: 4 points
- Run: 2 points
- RBI: 2 points
- At-bat: -1 point
PITCHING
- Win: 6 points
- Save: 8 points
- Inning Pitched: 3 points
- Strikeout: 1 point
- Hit or Walk Allowed: -1 point
- Earned Run Allowed: -2 points
BEST BALL
For those not familiar, best-ball scoring means your optimum lineup will be determined automatically each week without you ever setting a lineup. The only team management required is the initial draft and the two in-season FAAB periods. The NFBC site does the rest.
The intelligence is designed to account for corner infield, middle infield, utility and multiple position eligibility. There’s no delineation between starting pitchers and relievers – your top nine arms each week contribute to your total, regardless of their role.
PROPER RANKING USING POINTS SCORING
As discussed, back-testing using previous season’s final stats was used to produce a system that correlates very well to 5x5 roto-scoring. That’s all well and good but it’s still essential to come up with a draft list incorporating principles intrinsic to points scoring.
If you play fantasy football you know where this going. The key to points leagues is rankings should not be based on raw points but rather adjusted points using the last player drafted at each position as a baseline. The idea is everyone in the league is credited with the number of points scored by the worst active player at each position so the person with that player essentially earns no useful points from that player.
Mathematically, find the worst draft-worthy player at each position, subtract those points from everyone at the position and re-rank according to those adjusted points.
Truth be told, this is by no means perfect, especially in a best-ball format. The calculation only works if one player occupies each roster spot all season – which is obviously not the case. In addition, the use of corner, middle, utility and players that are eligible for multiple positions skew the replacement level. Still, doing the best you can to determine replacement is better than ignoring it. Ultimately, draft flow comes down to varying expectations of player performance but having a starting point where, at minimum, the players are ranked accurately relative to each other is very beneficial.
HOW MASTERSBALL GENERATES CUTLINE RANKINGS
Let’s start with the easy part – pitching. There are ten teams with nine roster spots so the expected points from the 90th highest total is subtracted from all the hurlers.
Hitting is where it gets dicey. Here’s what we know.
- Need 20 catchers
- Need 30 corner infielders, with a minimum of ten each at first and third
- Need 30 middle infielders, with a minimum of ten each at second and shortstop
- Need 50 outfielders
- Once those are all covered, need 10 highest left to be utility
Players with multiple eligibility are assigned a primary position according to this hierarchy:
C > SS > 2B > 3B > OF > 1B
This is how I view the strength of positions – you may see it differently. Your team, your call.
The projected points for all the hitters are calculated. The top-140 (ten teams, 14 roster spots) are examined to see if the above criteria are satisfied, starting with catcher and moving the hierarchy. If a position is short, the highest ranking player at that position is brought into the top-140, knocking out the lowest ranked player at a position that has not yet been checked. When finished, the top-140 should now consist of ample players at each position to fill all ten active rosters.
The lowest ranked player at each position is identified and those points are subtracted from every player with that same primary position. These adjusted points are used to rank hitters and pitchers together.
To reiterate, this process isn’t perfect, but it’s better than using unadjusted points. Because of the unique Cutline points system, the adjustment isn’t all the steep. However, to those playing in points leagues other than the NFBC cutline, omitting the adjustment is the biggest mistake made. The projected points for hitters and pitchers will be computed and it is wrongfully concluded that one is way more valuable than the other based on raw points.
GO BIG OR GO HOME
Before we go on to discuss some specific strategies, it’s necessary to set the proper mindset. Sure, there’s a league prize as the top-scorer in each ten-team league will pocket a nifty $250. Hopefully it’s obvious that the NFBC Cutline is a contest where you’re playing to win the whole kit and caboodle and not simply best nine others to double your money. As such, you’re going to need to take some chances along with being clever about roster construction to take best advantage of the best ball aspect.
Taking chances means jumping players with higher ceilings up the rankings. This doesn’t mean players with high stable floors but limited ceilings should be ignored. It just means you’ll need to increase your risk profile to defeat the thousands of teams trying to win the Cutline Championship.
There are three subsets of players that generally carry the most risk:
- Young players with a limited track record
- Foreign players
- Players with an injury history
Can Carlos Correa and Francisco Lindor’s sustain last season’s power spike? Can Corey Seager maintain such a high BABIP? Can Miguel Sano continue to be productive despite so many strikeouts? Will the league adjust to Noah Syndergaard? Can Raisel Iglesias take the next step? These are all legit concerns that may worry conservative drafters. Sorry, but caution will not take down the Cutline.
Neither Byung-ho Park nor Hyun-soo Kim have swung at Major League pitch in anger yet. Kenta Maeda hasn’t thrown a pitch that counts in the bigs. Sure, we’d like to see if they pass the eye test in the spring but we don’t have that luxury. Risk averse players prefer to dance with the devil they know. Winning the Cutline requires venturing into the unknown.
You can’t mess up your first round pick, right? Those that agree won’t be starting their team with Bryce Harper or Giancarlo Stanton. What about Yu Darvish? Or Carlos Gonzalez? Something to keep in mind is with best ball scoring, someone will always be there to backfill an injured player. Even though you risk carrying an empty roster spot, you won’t be getting a zero – you just have one fewer option to fill your best lineup.
Or you can combine all three and draft Rusney Castillo.
Please don’t misinterpret the above and throw a dart at every pick. All I’m saying is you need to pick and choose instances to let your hair down and go outside your comfort zone.
TAKING ADVANTAGE OF BEST-BALL SCORING
Consistency is a concept not all that relevant to standard rotisserie formats. You don’t care about the pathway; all you care about is a player’s season ending stats. However, the best-ball aspect of the Cutline affords several means to take advantage of the scoring to optimize your weekly scores.
Every player has a baseline expectation but there are factors that can raise or lower that expectation over the course of a scoring period – at least on paper. The idea is there will be some weeks a handful of players exceed their baseline and will be included in your total while others they fall below, to be replaced by some other players in a positive situation that period. Let’s take a look at some of these scenarios.
To be clear, the following should be applied to fringe players. The points of the better players will almost always end up counting in the best-ball accounting. However, there will be back-end players that have better and worse weeks that will find their way into your optimal lineup. It’s with these players you may want to look at a combination of what follows to maximize your week-to-week totals.
Home versus Away
Here’s some vitals to demonstrate the superiority a team has playing at home.
| PA | HR | R | RBI | HR% | BB% | K% | AVG | OBP | SLG | OPS | wOBA | wRC+ | |
| 2015 Home | 90121 | 2473 | 10556 | 10077 | 2.7% | 8.0% | 19.9% | 0.260 | 0.324 | 0.415 | 0.740 | 0.321 | 101 |
| 2015 Away | 93506 | 2436 | 10091 | 9577 | 2.6% | 7.4% | 20.9% | 0.249 | 0.310 | 0.394 | 0.704 | 0.306 | 92 |
| 2014 Home | 90220 | 2094 | 9967 | 9428 | 2.3% | 7.9% | 19.9% | 0.255 | 0.320 | 0.394 | 0.714 | 0.316 | 100 |
| 2014 Away | 93707 | 2092 | 9794 | 9317 | 2.2% | 7.3% | 20.8% | 0.247 | 0.308 | 0.379 | 0.687 | 0.304 | 93 |
| 2013 Home | 90546 | 2305 | 10185 | 9708 | 2.5% | 8.3% | 19.3% | 0.257 | 0.323 | 0.402 | 0.725 | 0.318 | 99 |
| 2013 Away | 94327 | 2356 | 10070 | 9563 | 2.5% | 7.6% | 20.4% | 0.250 | 0.313 | 0.391 | 0.704 | 0.310 | 94 |
Clearly, a player produces more at home. Note the homers are close home and away. This is due to the home team not hitting in the ninth when they have a lead. However, assuming the majority of your hitters hit in the upper half of the order, this isn’t an issues since they’ll usually get the extra plate appearance.
On the surface, this may seem like more of an in-season management ploy and thus not applicable for the Cutline but when you’re looking to win a tournament of this nature, you need help at the fringes.
Again, you’re not going to fade Paul Goldschmidt because of his schedule but you may look at the Diamondbacks schedule when considering Jake Lamb. To that end, here’s a review of the weekly schedules for each team (click HERE to download the spreadsheet). The heading represents the number of weeks each team has that number of home games. On the left is the first 14 weeks (before the initial cut) while the second is the nine-week playoff period.
| 7 or 6 | 5 or 4 | 3 or 2 | 1 or 0 | 7 or 6 | 5 or 4 | 3 or 2 | 1 or 0 | ||
| ARI | 2 | 5 | 4 | 3 | 2 | 2 | 2 | 3 | |
| ATL | 3 | 3 | 5 | 3 | 2 | 1 | 3 | 3 | |
| BAL | 3 | 3 | 5 | 3 | 2 | 1 | 4 | 2 | |
| BOS | 4 | 2 | 5 | 3 | 3 | 0 | 3 | 3 | |
| CHC | 4 | 1 | 4 | 5 | 3 | 2 | 2 | 2 | |
| CHW | 5 | 0 | 5 | 4 | 2 | 2 | 3 | 2 | |
| CIN | 3 | 4 | 2 | 5 | 1 | 3 | 2 | 2 | |
| CLE | 2 | 3 | 6 | 3 | 1 | 4 | 2 | 2 | |
| COL | 1 | 3 | 8 | 2 | 4 | 0 | 3 | 2 | |
| DET | 1 | 4 | 6 | 3 | 3 | 2 | 3 | 1 | |
| HOU | 3 | 4 | 4 | 3 | 1 | 3 | 4 | 1 | |
| KCR | 1 | 4 | 6 | 3 | 2 | 3 | 2 | 2 | |
| LAA | 0 | 7 | 5 | 2 | 3 | 1 | 3 | 2 | |
| LAD | 3 | 3 | 5 | 3 | 1 | 3 | 2 | 3 | |
| MIA | 2 | 3 | 6 | 3 | 1 | 3 | 1 | 4 | |
| MIL | 0 | 7 | 5 | 2 | 3 | 1 | 2 | 3 | |
| MIN | 1 | 6 | 5 | 2 | 2 | 1 | 3 | 3 | |
| NYM | 1 | 6 | 4 | 3 | 2 | 1 | 3 | 3 | |
| NYY | 3 | 2 | 4 | 5 | 1 | 3 | 2 | 2 | |
| OAK | 2 | 5 | 3 | 4 | 2 | 0 | 3 | 3 | |
| PHI | 3 | 4 | 4 | 3 | 3 | 1 | 2 | 3 | |
| PIT | 3 | 3 | 5 | 3 | 2 | 2 | 4 | 1 | |
| SDP | 3 | 4 | 2 | 5 | 2 | 1 | 3 | 3 | |
| SEA | 2 | 4 | 3 | 5 | 2 | 3 | 3 | 1 | |
| SFG | 1 | 6 | 5 | 2 | 3 | 0 | 3 | 3 | |
| STL | 1 | 7 | 2 | 4 | 0 | 3 | 2 | 3 | |
| TAM | 2 | 5 | 3 | 4 | 1 | 3 | 3 | 2 | |
| TEX | 0 | 6 | 4 | 4 | 2 | 2 | 2 | 3 | |
| TOR | 2 | 3 | 8 | 1 | 1 | 3 | 2 | 3 | |
| WAS | 2 | 5 | 3 | 4 | 1 | 3 | 1 | 3 |
We’ll save the detailed analysis for a stand-alone piece.
Park Factors
The key with park factors is there are several venues that are counter-intuitive. Some examples are
- Yankee Stadium plus for power barely positive for runs
- Kauffman Stadium crushes power but is slightly positive for runs
- Both Citizens Bank and PNC Parks are plus for power but basically neutral for runs
Applying park factors to your rankings is also tricky as you need to do it in concert with the scoring system and type of player. The Cutline scoring system really favors homers so power hitters are really helped by parks that elevate power. Players that get hits, score runs and drive in teammates but aren’t sluggers aren’t hurt by Kauffman Stadium. With regards to pitching, as noted, Yankee Stadium isn’t horrible at all, unless you’re a fly ball pitcher.
Thinking about pitchers, it seems obvious that starters scheduled to go twice have a great chance of making your optimal lineup. Considering it’s a given to choose fringe pitchers with venues that hurt run scoring, going one step further and looking for parks with the maximum number of 6 and 7 home games in a week increases the chances of two starts at home – which will really pump up that pitcher for that week. There’s no guarantee your pitcher’s two start weeks coincides with two home games – all we’re doing is looking to improve the chances.
This is another topic that’s worthy of further discussion, especially since the analysis goes hand-in-hand with home vs. away. Look for it soon.
Handedness
Here’s a look at platoon splits from the past three seasons.
| 2015 | OPS | wOBA | RC+ |
| vs RHP as LHB | 0.747 | 0.324 | 104 |
| vs LHP as RHB | 0.739 | 0.320 | 101 |
| vs RHP as RHB | 0.701 | 0.305 | 90 |
| vs LHP as LHB | 0.668 | 0.295 | 84 |
| 2014 | OPS | wOBA | RC+ |
| vs RHP as LHB | 0.713 | 0.315 | 100 |
| vs LHP as RHB | 0.731 | 0.322 | 105 |
| vs RHP as RHB | 0.684 | 0.304 | 90 |
| vs LHP as LHB | 0.647 | 0.290 | 83 |
| 2013 | OPS | wOBA | RC+ |
| vs RHP as LHB | 0.741 | 0.325 | 104 |
| vs LHP as RHB | 0.738 | 0.323 | 103 |
| vs RHP as RHB | 0.691 | 0.303 | 91 |
| vs LHP as LHB | 0.645 | 0.287 | 78 |
As expected, the largest spread is for left-handed hitters. Keeping in mind the idea is to embrace variance, using left-handed batters to fill out the back-end of your roster and reserves will lead to some weeks a team is facing a preponderance of righties, in theory increasing the lefty swinger’s performance over his baseline.
Contact Rate
You’re going to have to trust me on this but players with lower contact rates are generally more inconsistent than players that don’t fan as much. Combine this with a power hitter with a low contact rate and you have a highly variable player that will score very well the weeks he goes deep a couple of times while scuffling those periods the punch outs are prevalent. That’s fine – you’re approaching this with the assumption that with ample fungible players, someone will be in a good spot to cover your slumping slugger.
Stolen base specialists
One of the tricks of DFS is to identify pitchers and catchers (hopefully forming a battery) that are weak at controlling the running game. Sometimes you can find a team whose philosophy is to focus more on the hitter than runner thus allow an above average number of stolen bases. The repercussion is this puts base stealers in the inconsistent category when it comes to points-based scoring. Speed merchants will have weeks with multiple steals when they face the likes of Carlos Ruiz or Kurt Suzuki for a series. In roto, we often avoid these one-category contributors but in the Cutline, they’re perfect examples of players to target later – perhaps avoid early.
Multiple position eligibility and utility
According to the Mastersball projections, there are seven hitters that qualify at DH/UT only with just Miguel Sano and perhaps Evan Gattis expected to gain different eligibility. This means at least half of a Cutline league will have a player that can ONLY score points at DH/UT. This seriously hinders your ability to take advantage of a great week by a lesser player. Sure, he’ll bump someone, but the difference in points you gain isn’t as significant as compared to the edge if he filled one of your fungible spots. Of course, one way to counter the likes of David Ortiz or Prince Fielder blocking your utility is having a bunch of back-end players with multiple-eligibility. That said, having the utility spot as one of your intended spots for inconsistent players discussed above will really help take advantage of the variance and give you a handful of extra points each week.
Summing up
Yeah, I’m crazy thinking it’s going to take this sort of out-of-the-box thinking to win the Cutline – but I’m also right. Remember, this doesn’t apply to your early or even middle round picks. Let’s designate corner, middle, utility and two outfield spots for hitters (total of five) and four pitching spots you expect different players to occupy in your optimal lineup. That’s nine so beginning in Round 15 and through your reserves you focus on these highly variable players. Initially, that’s 22 candidates to fill nine spots. After one week that grows to 27 and eventually 32 players. Sure, there will be injuries but chances are you’ll always have more than twice as many options to take those nine spots. With those odds, there’s a good chance, most, if not all are filled by players enjoying a week over their baseline expectations. That’s how you win a contest of this nature.
As alluded to throughout this discussion, there are topics that require further treatment. Another is how to construct a best-ball pitching staff. Look for those discussions soon.
- Details
- Written by: Todd Zola
- Category: Organized Chaos
Several years ago, I introduced the concept of Category Efficiency Rankings (CER). The notion didn’t gain traction so it was abandoned. The idea involved massaging a conventional valuation set to render it more practical.
Fueling the move away from CER was a deeper understanding winning was less about pinpoint valuation and more about game theory and roster construction. Valuation shouldn’t be thought of in absolute, but rather in relative terms. Introducing a means of fine-tuning valuation simultaneous with preaching a more abstract drafting approach was confusing. Why do I have to think if CER does it for me?
Before delving into why it’s time to bring CER out of hibernation, let’s review valuation theory in general terms. Valuation is the process whereby a player projection is assigned a dollar value, ostensibly to be used in auctions, but also to proxy as a cheat sheet for drafts via ranking players by descending value.
There are three primary systems. We employ the Percentage Value Method (PVM). PVM distributes dollars in proportion to the players’ contributions to the respective categories. The most popular process is Standings Gained Points (SGP). Here, money is assigned relative to how each player helps a team earn points in each category. The last procedure uses standard deviations (SD). The player’s expectation is scored based on how many standard deviations it is from the mean of each category, then budget is distributed as a percentage of the player’s summed standard deviations across all categories to those of the field.
Regardless of the method, valuation is flawed. Plus, an output is only as good as its input, and the error bar associated with player projections is estimated around 30 percent. The dollar value is not only a function of the player’s projections, but also encompasses that of replacement level players and the cumulative contributions of the draft-worthy field. It’s plausible to nail a player’s projection but to miss on the dollar value if the other factors are off. As mentioned, my preference is for PVM. SGP is intrinsically flawed while SD lacks a theoretical basis.
The flaws with SGP pertain to the non-linear nature of each category. If it takes 5 units of a stat to gain a point in that category based on average standings and the player projects to producing 20 units, they are assigned four SGP (20/5). However, when you add up the SGP for each category, they’re all different. All categories count the same, therefore an equal number of SGP should correspond to each.
The discrepancy emanates from the uneven, top to bottom distribution in the categories. The lowest team gets one point. To earn more, other teams need to eclipse this barrier. Let’s define barrier SGP as the last place total divided by the units necessary to gain a point in that category. If stats were evenly distributed, the barrier SGP would be the same across the board, but they’re not. Typically, the barrier SGP for stolen bases is much lower than the other hitting categories (the same for saves in pitching) skewing the balance. While this is a flaw with the system, as will be explained later, it serendipitously acts in a positive manner. Still, I have an issue endorsing a method that’s right for the wrong reasons.
The SD method exhibits the same downfall as SGP; the sum of the SD per category aren’t consistent. In addition, while the SGP method has an elegance in its genesis, there’s no theoretical basis between standard deviations and the extent the player helps a team succeed.
PVM is far from perfect, but at least the theoretical foundation and math make sense. Other than the flaws inherent to all methods, the primary shortcoming of PVM is while value is allocated proportionately, spending the same amount in each category doesn’t result in equal points in each. The reason is the unequal distribution of stats within the categories.
They say a picture is worth a thousand words so let’s use an image to illustrate the above. Data from the 2016 National Fantasy Baseball Championship Main Event will be employed. These are 15-team, mixed leagues with no trading so the player pool is as homogenous as possible. Results from 30 leagues were used to determine average standings. That is, the average total was calculated per category for each standings place.
The key is converting average standings to normalized standings. The entails assigning each category an equal number of units, we’ll use 1000. The average stats at each standings point are scaled so the sum of the 15 spots is 1000 for each. Here’s the plot:
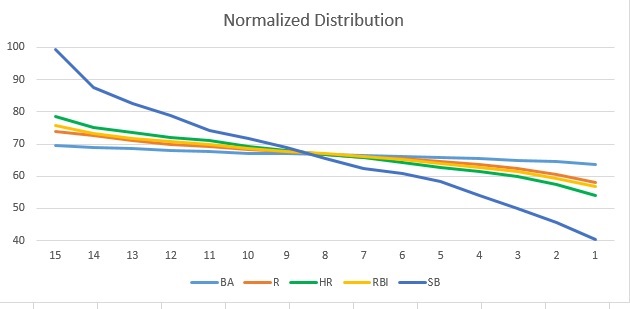
As suggested, the last place team in stolen bases has fewer units relative to the other categories. As one may intuit, runs and RBI track closely. Homers have the second lowest last-place barrier but it’s significantly higher than steals. Most noteworthy is the flatness of the batting average distribution. This will be of utmost importance when we get to CER adjustments.
Let’s save another 1000 words to graphically display how spending the same amount in each category yields a different number of points. Here, the budget allotted for each hitting category is computed based on conventional valuation methods. The standard budget is $260. While this differs by league, on the average, 69 percent of the budget is spent on hitting. These leagues have 15 teams with five categories so the amount dedicated per hitting category is $260 x 15 x .69 / 5 = $538.20.
Similar to categorical stats being normalized to 1000 units, they can be normalize to $538.20 showing how many points should be earned by spending a specific amount:
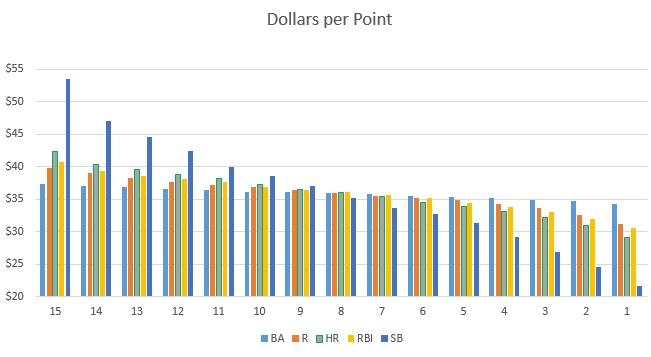
Keep in mind we’re all looking for a positive return on our investment, so if we spend, say, $36 in a category we’re hoping to accrue over $40 worth of points. Still, either you need to spend a lot more or get a huge profit in steals to finish in the upper third of the standings. This is relevant since league champions generally amass 115-125 points, an average of 11.5 to 12.5 in each category.
The $36 above wasn’t arbitrary. Distilled down to the team level, equal spending per category amounts to $35.88 each. Not-so-coincidentally, that lands at the midpoint in the standings per category, hence the obvious need to derive profit to win. For what it’s worth, it usually takes $320 worth of stats to drive down victory lane
Relating this to CER, doesn’t it make sense to allocate more budget to homers? Adding $3 to homers yields 13 points while subtracting $3 from steals renders 6 points for a total of 19. Equal spending returns 16 points. Again, profit is expected regardless of the amount spent. But even that favors funneling budget away from steals and to homers. The landing in steals is just past where points between adjacent teams is greater. On the other end, just a little profit in homers earns 14 or 15 points, along with contributing to runs, RBI and even batting average, something relevant that hasn’t been broached yet.
Speaking of batting average, look at how little money separates first and last place, barely $3. Plus, batting average is the most unpredictable category as there’s more variance. Shunting budget from average may not even sacrifice points if one or two hitters get a little lucky with batting average on balls in play. Truth be told, aiming for a low average in lieu of more counting stats is a common ploy. The above chart lends credence to the tactic.
There are two more reasons favoring drafting homers in lieu of steals. The first is the way league champions fared across the hitting categories. Here’s the average number of points the 30 league winners totaled in each of the hitting categories:
| BA | R | HR | RBI | SB |
| 11 | 13.1 | 12.9 | 13.1 | 11.9 |
Victors scored highest in runs, homers and RBI, a full standing place higher than steals and two more than batting average. This is in perfect sync with the conclusion drawn from the charts above; spend more on homers, take away from steals and batting average.
The other justification takes advantage of what’s available in season. Traditionally, more stolen bases than homers are added via free agents. One way to show this is comparing drafted stats to season-ending numbers. Using the NFBC Main Event, the stats derived from treating opening-day rosters as a draft-and-hold, then comparing those totals to actual final numbers, historically 90 percent of homers are acquired on draft day, in contrast to 85 percent of swipes. It’s not much of a difference, but is sufficient rationale to focus more on homers at the draft table.
Pulling things together, there are three viable reasons to devote more draft-day attention to homers at the expense of steals:
- Category distribution
- Champions fare better in homers
- More steals are available for in-season acquisition
Those with extensive experience can likely assemble a quality squad without CER adjustments. But why not get a nudge from more practical rankings?
Before addressing that question, let’s circle back to the contention that SGP, and to a lesser extent SD, are right for the wrong reasons. Here’s the 2016 end-of-season earnings for the top hitters per each system:
| PVM | SGP | SD | |
| Mookie Betts | $43 | $41 | $42 |
| Jose Altuve | $41 | $38 | $40 |
| Mike Trout | $40 | $39 | $39 |
| Jonathan Villar | $39 | $34 | $31 |
| Paul Goldschmidt | $34 | $33 | $32 |
| Jean Segura | $34 | $30 | $31 |
| Charlie Blackmon | $33 | $31 | $33 |
| Nolan Arenado | $32 | $35 | $35 |
| Kris Bryant | $31 | $32 | $32 |
| Brian Dozier | $30 | $31 | $29 |
The pair to focus on are Jonathan Villar and Nolan Arenado. Note how much higher PVM places the stolen base leader Villar while lagging on Arenado, who swiped only two to complement his 41 homers. Serendipitously, SGP accounts for the three bullet points above.
Now consider that SGP is the most popular valuation process so most of your league-mates will be guided by SGP ranks. Experienced players intuitively know to go the extra buck on sluggers like Arenado and be careful with speedsters like Villar or their team will suffer a paucity of power in lieu of a surplus of speed.
Until recently, I opted to direct writing energy towards this Zen style of drafting, rooted in numbers and analysis but with an overall awareness of team construct. While this is still largely the manner I’ll draft, there’s a tangible benefit to utilizing CER. Hence, the decision to relaunch the concept, in hopes this time it germinates.
Two obvious questions are now on the table. What should the adjusted category weights be and what about leagues of different size and format? Let’s work backwards.
All the described trends transcend standard 5x5 leagues. The categorical distributions are slightly different, but in the abstract, the same three reasons supporting CER for 15-team mixed leagues hold true in all leagues.
That leaves the big question, how should the hitting budget be allocated for most efficient spending? Unfortunately, there isn’t a one-size-fits-all answer. Plus, remember values and ranks are still just a guide. Reading the room to optimize roster construction is still paramount.
At the beginning, it was stated that valuation shouldn’t be thought of in absolute but rather relative terms. It’s not that a $25 player is worth $25 and a $24 player is worth $24. It’s that’s in a vacuum, the $25 guy contributes a little more than the $24 guy. Who knows, maybe the contributions of the $24 player are more useful based on your team construct. Still, the better the relative ranks, the better your basis for making decisions.
Here’s an example of a logical category adjustment based on the data presented for the NFBC Main Event content. It was already demonstrated that taking $3 from steals and giving to homers results in three more points so let’s start there. The flatness of the batting average curve screams to borrow from Peter to pay Paul, so let’s take $2 and give a buck each to runs and RBI. Lastly, to account for the second and third justifications for CER, let’s grab another buck from steals and award it to homers. Keeping in mind the starting point is $35.88 for each, the final dollars per category are:
| HR | RBI | SB | BA | R |
| $39.88 | $36.88 | $31.88 | $33.88 | $36.88 |
My value calculator allows customization of the category weights. The default is 1 for all five, which was used to generate the PVM earnings presented earlier. Converting the adjusted budget distribution to category weight yields:
| HR | RBI | SB | BA | R |
| 1.11 | 1.03 | 0.89 | 0.94 | 1.03 |
Plugging those coefficients into the value calculator renders CER earnings, displayed with those already shared:
| PVM | SGP | SD | CER | |
| Mookie Betts | $43 | $41 | $42 | $43 |
| Jose Altuve | $41 | $38 | $40 | $41 |
| Mike Trout | $40 | $39 | $39 | $40 |
| Jonathan Villar | $39 | $34 | $31 | $36 |
| Paul Goldschmidt | $34 | $33 | $32 | $34 |
| Jean Segura | $34 | $30 | $31 | $33 |
| Charlie Blackmon | $33 | $31 | $33 | $33 |
| Nolan Arenado | $32 | $35 | $35 | $34 |
| Kris Bryant | $31 | $32 | $32 | $32 |
| Brian Dozier | $30 | $31 | $29 | $30 |
Villar is still higher with CER but he deserves it, in a vacuum steals are extremely valuable. Sure, we can empirically adjust the category coefficients to match SGP, but why not just use SGP? From where I sit, being guided by the better PVM process, then monitoring team construct is the best of both worlds. The impact of Villar, and other speedsters, is softened, but not mitigated. This seems fair.
With respect to Arenado, and other sluggers, their value is poked up to almost match SGP and SD. Understanding the imperfection of projections and valuation theory while keeping in mind we’re talking about relative and not absolute rankings, the CER adjustment is plenty convincing to go the extra buck or two so you aren’t devoid of ample power. The kicker is if you’re bidding against others using PVM, you may split the difference and not have to bid the full CER increase.
Well friends, there you have it, the case for CER, part objective, part subjective. While some may be wary of the subjectivity, that’s the beauty of it. It’s not a one-size-fits-all entity. Some need more of a push than others. Different leagues have different characteristics, especially those of the long-standing variety with established trends. Combining the advantage CER offers along with your expertise is a surefire recipe for success. Let’s swap victory stories in the winner’s circle!
- Details
- Written by: Todd Zola
- Category: Organized Chaos
Can you believe it? We’re about to embark on our 21st season on this Interweb thing. Who knew, way back in March of 1997, what the next twenty years would bring. For me, it paved the transition from a career as a peptide chemist to making my living as a fantasy writer. We’ll have plenty of time to reminisce as we celebrate our 20th anniversary in the spring. Of immediate focus is…
Platinum 2017 will be launching on Tuesday, November 15!
Once again, we’re the FIRST source of projections, rankings and dollar values specifically tailored to fantasy baseball enthusiasts, like yourself. The initial drop will be just projections. As always, we’ll roll out all our additional content throughout the off-season. This includes Lawr Michaels unique Top-250 Minor League rankings, Perry Van Hook’s minor league rankings focusing on the 2017 season and of course my player profiles and all the other goodies to aid in your draft prep.
New this season, I’m writing The Z Book, a collection of strategy and game theory essays. I promise you won’t find anything like it anywhere. The Z-Book will be part of your Platinum subscription as well as available for separate purchase. The ETA is February 15, giving you ample time to digest everything in time for the primary drafting season in mid to late March. Topics will include
- Detailed review of projection theory
- Detailed review of player valuation
- Using projection theory and player valuation to win your league
- Scarcity, Shmarcity
- Park Factors: A Necessary Evil
- Using wOBA and K% for DFS: When are splits actionable?
- Rethinking how we rank catchers
- And more!
Let’s be honest. If you’re already yearning for projections and rankings, there’s a good chance you’re preparing for the early pay-for-play drafts. Granted, there are exceptions, those that want to get going on keeper and dynasty league preparation but most early subscribers are getting ready to draft in high stakes contest. The majority of these are of the draft and hold variety, with ultra-deep rosters. As such, you’ll want projections and rankings for everyone with a chance to see action anytime in 2017.
Don’t worry, we have you covered!
We’ve gone over the prospect lists and will have a projection for any player with a modicum of a chance to play this season. Anyone missed that’s drafted in any national contest will be added to the next posted projection set. Shoot, if you’re thinking of drafting a player not projected, drop me a line and I’ll ask my little black box to do its thing.
More good news for those that play in leagues with non-standard categories. I’ll be adding new statistics to the projections, most notably quality starts for pitchers among others. I can open the floor for requests, with the understanding I may not be able to honor it. If the data is available and the projection is easily automated, I’ll gladly add it.
Why use Mastersball Platinum? Four of the past five National Fantasy Baseball Championship (NFBC) Main Event Champions are subscribers. This includes our own Greg Morgan, who writes a monthly column on the NFBC, available free the first Thursday of each month. The Mastersball staff aren’t just writers, we play too. Lawr Michaels is a two-time AL Tout Wars champion, Brian Walton has won NL Tout Wars while Zach Steinhorn is the defending champion of Mixed Auction Tout Wars. Pardon the humblebrag, I won both NL Tout Wars and Mixed LABR in 2016, along with being among the career earnings leaders in NFBC auctions, including winning the NL only league three times and co-owning an Ultimate Auction winner.
The price for 2017 Mastersball Platinum will be $39.95 – worth all 3995 pennies, I promise. If you haven’t registered, please take a moment to do so, using the box in the upper-right part of the home page. Then on Tuesday the 15th, log-in and click on the SUBSCRIBE NOW link under the site masthead on the right side. At the bottom, you’ll see SUBSCRIBE button taking you to the PayPal subscription page. You’ll have immediate access to the 2017 initial projections and rankings. If you prefer to pay by check, drop a note to support@mastersball.com and we’ll arrange payment and prompt access.
Questions? Hit me up in the comments section.
Fasten your seatbelt, 2017 promises to be our best season yet!
- Details
- Written by: Todd Zola
- Category: Organized Chaos
New for the 2016 fantasy baseball season is a unique contest offered by our friends at the National Fantasy Baseball Championship (NFBC) called the Cutline Championship. A complete review of the rules can be found HERE.
In brief, the Cutline Championship is a points-based, best-ball scoring format. The leagues consist of ten teams and use standard NFBC roster requirements and position eligibilities. There will be an initial snake draft to fill 36 roster spots then a pair of in-season FAAB periods. The first is the week after the season starts where you can add up to five more players with the second in early June where you can add as many as you want to a maximum of 46 roster spots. The regular season ends right around the All-Star break where teams will be entered into the Cutline Finals, Consolation Round or have their season end. More teams will be eliminated over the next nine weeks until a Cutline Champion is crowned in early September.
What follows is a primer for those entering the inaugural Cutline Championship. Even though the discussion will focus on that contest, many of the principles transcend into other formats, so hopefully all Platinum subscribers can glean a nugget or two to help in their draft prep.
SCORING
The Cutline scoring is designed so that the ranking of the players by points emulates the ranking via standard 5x5 rotisserie scoring. The hitter’s correlation coefficient is .99 while the pitcher’s is about .90.
A noteworthy difference between the Cutline and other NFBC contests is there isn’t a Friday transaction day for hitters. The scoring period for everyone runs from Monday through Sunday.
Points are awarded as follows:
HITTING
- Home Run: 6 points
- Stolen Base: 5 points
- Hit: 4 points
- Run: 2 points
- RBI: 2 points
- At-bat: -1 point
PITCHING
- Win: 6 points
- Save: 6 points
- Inning Pitched: 3 points
- Strikeout: 1 point
- Hit or Walk Allowed: -1 point
- Earned Run Allowed: -2 points
BEST BALL
For those not familiar, best-ball scoring means your optimum lineup will be determined automatically each week without you ever setting a lineup. The only team management required is the initial draft and the two in-season FAAB periods. The NFBC site does the rest.
The intelligence is designed to account for corner infield, middle infield, utility and multiple position eligibility. There’s no delineation between starting pitchers and relievers – your top nine arms each week contribute to your total, regardless of their role.
PROPER RANKING USING POINTS SCORING
As discussed, back-testing using previous season’s final stats was used to produce a system that correlates very well to 5x5 roto-scoring. That’s all well and good but it’s still essential to come up with a draft list incorporating principles intrinsic to points scoring.
If you play fantasy football, you know where this is going. The key to points leagues is rankings should not be based on raw points but rather adjusted points using the last player drafted at each position as a baseline. The idea is everyone in the league is credited with the number of points scored by the worst active player at each position so the person with that player essentially earns no useful points from that player.
Mathematically, find the worst draft-worthy player at each position, subtract those points from everyone at the position and re-rank according to those adjusted points.
Truth be told, this is by no means perfect, especially in a best-ball format. The calculation only works if one player occupies each roster spot all season – which is obviously not the case. In addition, the use of corner, middle, utility and players that are eligible for multiple positions skew the replacement level. Still, doing the best you can to determine replacement is better than ignoring it. Ultimately, draft flow comes down to varying expectations of player performance but having a starting point where, at minimum, the players are ranked accurately relative to each other is very beneficial.
HOW MASTERSBALL GENERATES CUTLINE RANKINGS
Let’s start with the easy part – pitching. There are ten teams with nine roster spots, so the expected points from the 90th highest total is subtracted from all the hurlers.
Hitting is where it gets dicey. Here’s what we know.
- Need 20 catchers
- Need 30 corner infielders, with a minimum of ten each at first and third
- Need 30 middle infielders, with a minimum of ten each at second and shortstop
- Need 50 outfielders
- Once those are all covered, need 10 highest left to be utility
Players with multiple eligibility are assigned a primary position according to this hierarchy:
C > SS > 2B > 3B > OF > 1B
This is how I view the strength of positions – you may see it differently. Your team, your call.
The projected points for all the hitters are calculated. The top-140 (ten teams, 14 roster spots) are examined to see if the above criteria are satisfied, starting with catcher and moving the hierarchy. If a position is short, the highest ranking player at that position is brought into the top-140, knocking out the lowest ranked player at a position that has not yet been checked. When finished, the top-140 should now consist of ample players at each position to fill all ten active rosters.
The lowest ranked player at each position is identified and those points are subtracted from every player with that same primary position. These adjusted points are used to rank hitters and pitchers together.
To reiterate, this process isn’t perfect, but it’s better than using unadjusted points. Because of the unique Cutline points system, the adjustment isn’t all that steep. However, to those playing in points leagues other than the NFBC cutline, omitting the adjustment is the biggest mistake made. The projected points for hitters and pitchers will be computed and it is wrongfully concluded that one is way more valuable than the other based on raw points.
GO BIG OR GO HOME
Before we go on to discuss some specific strategies, it’s necessary to set the proper mindset. Sure, there’s a league prize, as the top-scorer in each ten-team league will pocket a nifty $250. Hopefully, it’s obvious that the NFBC Cutline is a contest where you’re....
Sorry friends, I need to save the rest for the Platinum subscribers. The remainder of this discussion along with Cutline rankings are now posted for Platinum. Please note we are very close to unveiling a promotion where you can get $20 off the regular cost of $34.95. If you qualify for the promotion, we'll gladly refund $20 off the purchase price once we are able to go live. To subscribe, click HERE. Please make sure you're registered and logged into the site. You can create an account via the log in box on the home page.{jcomments on}