
- Details
- Written by: Todd Zola
- Category: Organized Chaos
The defense of my 2019 The Great Fantasy Baseball Invitational overall title has begun, and according to some, I’m already mathematically eliminated. From the Lucky-13 hole, I went off-book, at least according to ADP and chose Starling Marte. Here’s why.
Most importantly, I care far more about my rankings than ADP (average draft position). If there was a chance Marte would have made it to me in Round 3, I may have played ADP chicken. However, he’s in my Top-10 and was my highest rated player still on the board.
It’s fair to ask why not wait until Round 2? Good question. The next player on my list was J.D. Martinez, another guy with a later ADP, but not late enough to be around in Round 3. However, I have Martinez and Freddie Freeman essentially ranked the same, so I preferred to lock in Marte and take whichever was left for me in the second, expecting Freeman to be gone. As it turned out, Freeman was available, so I opted for the Braves first baseman, feeling he was a tad safer than Martinez.
Back to Marte and why he’s ranked so high for me. With my first-round pick, I’m not looking for upside; I want to build a foundation of stats I can write in. Marte has a solid track record with a power-speed base. Plugging it into my formula, he lands Top-10. That said, rankings aren’t just an ordering of “value”. I consider the reliability and team construction element and Marte fit what I want to do.
Some point to Marte’s durability as a first rounder. Yes, he’s missed time the last two seasons, but my formulaic rank assumes just 600 plate appearances, the average of the previous two campaigns. Remember he was suspended for 80 games in 2017, so the 77 games total is misleading. Last year, Marte missed time early after colliding with teammate Erik Gonzalez. In September, he hurt his wrist bracing a fall. While not flukes, neither are chronic nor involved his legs, relevant for someone reliant on speed. If Marte always missed time with a groin or hamstring issue, that would be different.
The other aspect of only expecting 600 PA is someone can backfill the roster spot with free loot. When you draft or purchase a player, you’re paying for the roster spot, not the player. If Marte misses time, especially with TGFBI/NFBC rules, hitters can be moved in and out of the lineup twice a week so I’m paying for Marte’s stats and perhaps getting a few transaction periods of someone else. If Marte doesn’t get hurt, the free loot is from him, so there’s some organic upside from playing time.
Marte is on the other side of 30 years old when speed sometimes wanes, but he’s still running with 92nd percentile sprint speed, so even if he loses a little this season, there’s plenty left to pilfer some bags. I’m not concerned about going to a new team. You don’t trade for Marte and tell him not to run. The best skippers manage to their player’s strength.
One of the biggest knocks on Marte is the ability to maintain 20-something homers, citing a big ground ball tilt and a low average exit velocity. Obviously, I have no counter for the high ground ball number, except it helps him in the batting average department. However, I have a unique perspective on the average exit velocity argument. Marte’s overall average exit velocity is just 23rd percentile but his mark on fly balls is above average. There’s something about Marte’s swing mechanics where he hits fly balls with more authority and grounders with less, likely due to an uppercut pathway at contact. The plethora of grounders could be he doesn’t center the ball often, instead topping it. But, when he does center it, the resultant fly balls are hit with more authority, thus Marte can maintain an elevated HR/FB mark.
From a venue point of view, Marte’s power should improve. The humidor has calmed Chase Field down, but it’s still 10% more favorable for righty power than PNC Park, plus Marte will visit Coors Field for three series. Maybe this is reaching too far to justify the pick, but Phoenix is at one of the higher elevations so pitched balls don’t move as much. Maybe this helps Marte center more contact, lofting it instead of banging it into the turf.
That’s my story and I’m sticking to it.
- Details
- Written by: Todd Zola
- Category: Organized Chaos
Previously, the hitting and pitching projection zystems were described. Now it's time for the next step - valuation. Please note this is an edited version of an essay first written in 2010 and abridged over the years. At the end, I’ll chime in with some present day commentary.
Introduction
Simply stated, fantasy baseball is a game in which you assemble a team of real baseball players whose statistics are used to score and ultimately rank your team. To do this effectively, you need to do three things
- Project player performance
- Crystallize projected performance into currency so you can compare how much each player can help you both with respect to other players of the same position as well as across positions
- Assemble your championship squad.
This essay will focus on the middle aspect, the quantification of performance, perhaps better known as player valuation.
There are a bevy of valuation systems in use to quantify statistics. Why are there multiple? Because there is no definitive right or wrong. There is no precise manner to put a static designation on a fluid entity. There may be better ways, but it follows that if there were truly a correct or even best way, that would be basically universal. Admittedly, in my younger, more naïve days I felt the method I am about to describe was the be‐all‐end‐all and dedicated my life to that crusade. But over the years, I have developed a truer grasp of what it really takes to succeed at this endeavor and have softened my stance. Player values and rankings are a guide, a piece of the puzzle. I much prefer being recognized for my acumen in the third element of the hobby described above, the assembling of your squad than being known as the premier valuation guy in the industry, though that does have its advantages. That said, those of you that favor the popular SGP method are using an inferior process as it is theoretically and mathematically flawed. After all, I softened, not completely changed my stance.
What you need from a valuation system is a snapshot view of what a player is worth relative to other players. Since this snapshot is composed of several elements, it also helps if you have an idea of what comprises that snapshot. It really helps if you understand how the snapshot is generated, so you can do some massaging to the system to best make it work for your league and its unique tendencies.
What you don’t need is a green light, red light designation of perfectly accurate value. I chalk it up to the maturation process, both as a person and a fantasy gamer, but I honestly feel the focus I put on “proper player valuation” stunted my growth as a player, detracting from my ability to look at the big picture, understanding how to use that piece of information most efficiently.
With all that said, what follows is a description of a valuation process that I believe to be most effective when looking at the big picture. It does not presuppose anything in terms of player value. It gives an unbiased snapshot of how each player can help your squad. It is incredibly flexible, so it can handle any tweak or alteration you feel necessary. It can account for all aspects of your league’s dynamics and does so in a sound philosophical as well as logical manner.
The Concept
Simply put, value is distributed in proportion to each player’s contribution to the overall player pool. If I have $1000 to pay a crew for doing a job, someone did 50% of the work gets $500. If someone else did 30%, they get $300, leaving $200 for the remaining 20% contribution of the third member.
Of course, valuing players for rotisserie style scoring is more complex as contributions are across multiple scoring categories. The player’s contribution in each category is determined, and these are all summed for a total value
Boundarie$ and Parameter$
Even though much of the introduction was designed to drive home the point that ultimately the value assigned should be viewed rather loosely, we still need to treat the system in a static nature. As such, there are several logical boundaries and parameters of a sound valuation method.
Let us begin with what will be referred to as the draft‐worthy pool. The draft‐worthy pool should be composed of exactly enough players to field a league full of legal rosters, taking into account positional requirements. By means of example, a 12‐team league with 14 hitters and 9 pitchers will have a draft‐worthy hitting pool totaling 168 players, with 108 in the draft‐worthy pitching pool. More specifically, if the positional requirements are the standard 2C, 1B, 2B, 3B, SS, CI, MI, 5OF and UT, then there needs to be 24 C, 12 1B, 12 2B, 12 SS, 12 CI, 12 MI, 60 OF and 12 UT in the hitting pool.
Because most rules specify a minimum bid of $1 on each player, the lowest ranked player of the draft‐worthy pool should be worth $1, with the top‐ranked non‐drafted player being $0. An argument can be made this condition should be set upon each position. That is, the worst catcher in the draft‐worthy pool be set at $1, the worst second baseman $1, etc. Later, the mathematical manner to do this will be detailed.
Values should be assigned in a zero‐sum nature. A typical team budget is $260. That means our 12‐team league has $3120 to spend on the previously discussed 168 hitters and 108 pitchers. The entire $3120 should be exactly distributed amongst the 276 players comprising the draft‐worthy pool.
Because the points earned in each scoring category in most rotisserie league are equal, the money assigned to each should be the same. For example, in leagues that use a $260 budget with 5 hitting and 5 pitching categories, you should plan on spending $26 for each. However, as most everyone knows, conventionally, more money is spent on hitting than pitching. Currently, the average 5x5 league spends 69% of its budget on hitters. This drops to 67% in the ever‐disappearing 4x4 leagues. This equates to each 5x5 team budgeting $179.40 ($35.88 per category) for hitters and $80.60 ($16.12 per category) for pitching. In a global sense, a 12-team league distributes $430.56 per hitting category and $193.44 per pitching category.
Replacement Level and the Concept of Useful Stats
We have already established that each player’s value is assigned according to the summed percentage contribution across the categories. The number of players with a value of $1 and greater is dictated by the number of teams in the league and positional requirements while the total amount of money distributed is equal to the number of teams multiplied by the team budget.
All we have left is to determine the player’s contribution to each category. This involves employment of a concept that is becoming more and more familiar to the baseball statistical community and is generally referred to as value above replacement. Personally, I prefer to explain it in terms of useful statistics.
In short, I have an issue paying for something I can get for free. Okay, this does not explain my penchant for buying bottled water, but I digress. In fantasy baseball terms, due to the positional restraints of legal lineups, there is a certain level of statistics that everyone has on their roster. If everyone has these, why pay for, ergo, place a value on them? It does not make sense. If you are doing a football pick‐‘em pool and everyone chooses the same team to win, the result of that game is inconsequential. If the worst catcher on a roster in a fantasy league is projected to hit 5 homers, then everyone in the league has those same 5 homers, so why pay for them? What you want to pay for is that which differentiates you from the rest. I term these “useful statistics”. To bring the point home, our system only values these useful stats.
Here is an example I like to use to demonstrate the concept and utility of useful stats. Let us set up a 2‐team HR derby league, you and me. We each need a player from Group A and one from Group B. I will give you first pick. Here is the available player pool:
GROUP A
- Red – projected to hit 45 HR
- Blue – projected to hit 40 HR
GROUP B
- Green – projected to hit 25 HR
- Yellow – projected to hit 15 HR
So, who do you want? Hopefully Green. Why? If you take Red because he is the best hitter, I will take Green then Blue for a total of 65 HR. You get Red and Yellow for a total of 60 HR and I get to call SCOREBOARD!!!
Here is how the pool should be considered:
GROUP A
- Red – projected to hit 5 H
- Blue – projected to hit 0 HR
GROUP B
- Green – projected to hit 10 HR
- Yellow – projected to hit 0 HR
This represents the number of USEFUL homers each batter swats.
At this point, you may be wondering if this is the mathematical manner to deal with positional requirements, that is, what if instead of 2 groups there were 6 and instead of alphabetical designation, there were catcher, first base, second base, etc.? You are very wise, Grasshopper.
This is precisely the manner proper valuation should be conducted and will also result in the worst player in each pool being valued at $1 as discussed previously. It also explains why 20 homers from a catcher are worth more than 20 homers from a different position. In 2‐catcher leagues, the same 20 homers account for more useful homers for the catcher as the amount subtracted from the replacement catcher is smaller than that of the other positions. In mixed leagues 15 or 16 of a catcher’s 20 home runs are useful as compared to perhaps only 12 or 13 for the other positions.
While it is easiest to explain the concept of useful stats using a simple home run derby league, the fact there are multiple categories in standard rotisserie formats adds a significant layer of complexity to the process. The way we overcome this issue is to employ a mythical replacement player, who is a composite of the worst players at each position. You cannot single out a particular player as there are many reasons why a player is of low value. He could have a poor batting average but decent counting stats. He could have a poor average and low power, but a lot of steals. His average could be solid but the associated production minimal. The point is, using an individual player to set the replacement level can skew the useful stats as the adjustment could be too much or too little. So instead, we use the mythical player who has a mythical stat line representing the average production of the last few replacement level players
A final point to be made is some draft‐worthy players may in fact contribute a negative value in a counting stat category if their contribution is lower than that of the mythical replacement player in that category.
Converting Ratio Stats to Counting Stats
There is one final speed bump that we need to deal with before we are ready to tie it all up. It is straightforward to envision the distribution of value with the categories involving the counting stats such as HR, RBI, runs, SB, wins, saves and K in standard formats. It is a mite trickier with respect to the ratio categories of BA, ERA and WHIP. We need to convert a ratio stat to a counting stat. This exercise is worthy of an essay unto itself, so I will just provide the Cliff Note’s version and encourage questions on the message forum.
What we do is take the player’s ratio and compare it to a baseline ratio, then multiply the difference by at bats or innings pitched to apply a weight. We have empirically determined that the most effective baseline ratio is that of the typical last place team in your league of the category in question.
Since the baseline batting average for hitters is numerically lower than what you expect for a useful hitter, the baseline average is subtracted from the player’s average and multiplied by at bats. On the other hand, since a superior ERA and WHIP are numerically lower than the baseline, they are subtracted from the baseline and multiplied by innings. The resulting number is now treated the same as a counting stat.
Treatment of Middle Infield, Corner Infield and Utility Positions along with Multiple Eligibility Players
The in‐depth manner to account for the fact that either a second baseman or shortstop can fill middle infield, a first baseman or third baseman can be slotted at corner and all hitters can fill utility is beyond the scope of this essay. For those interested, the explanation is provided in other site material. For this essay, let us assume in our model league above the middle infield pool is composed equally of 6 second basemen and 6 shortstops while the corner pool has 6 first basemen and 6 third basemen. We will also assume the utility pool is all outfielders and DH‐only. This means the draft‐worthy pool will include 24 catchers, 18 at each infield position and 72 outfielders. In your league, the actual spread will be different. We explain how to deal with this in primers explaining the actual usage of the site’s CVRC (customizable value and ranking calculator).
As you know doubt are aware, some players carry multiple eligibility. We use the assumption that they will be drafted at the position they enjoy the most value. As such, we designate positions according to the following positional hierarchy:
C > 2B > SS > 3B > 1B > OF
Putting it All Together
We now have everything necessary components to determine dollar values. We can determine the number of useful stats each player contributes by subtracting the corresponding replacement level across the positions. Using our model league and considering just home runs, the top 24 catcher useful home runs total, the top 18 homer totals at each infield position and the top 72 outfield homer totals are all summed and represent the total of useful homers for the draft‐worthy pool. Value is then assigned according to the percentage of useful homers each player contributes multiplied by the monetary amount assigned for the pool.
By means of example, let us say the pool of homers for the draft‐worthy pool is 2000. An outfielder is projected to hit 40 and the replacement at the position is 10. He is thus given credit for 30 useful homers. According to our calculations above, each hitting category is allocated $430.56. The players HR$ is then 30/2000 x $430.56 or $6.46. This is done in a similar manner for the other categories and the individual categorical contributions are summed for a final value.
To emphasize a point discussed previously, let us consider a catcher that is projected to hit the same 40 homers as the outfielder. The difference is the replacement level for catchers is no doubt less than that for outfield, perhaps only 5. This yields 35 useful homers for our catcher, translating to a HR$ of $7.53. The same 40 raw homers are worth more coming from a catcher as he contributes more useful homers to the global total.
In the name of full disclosure, there is still some algebraic tweaking necessary as doing replacement in this fashion results in a hitting pool not necessarily composed of exactly 168 players and a pitching pool with precisely 108 hurlers. The take home lesson is not this adjustment, but the understanding of how we assign player value in a global sense.
Making the Theoretical Practical
You can now put away your calculator. We are done considering the value calculation as a static entity. While it is true that what has been described is a theoretically logical procedure, it is not an entirely practical means of assigning value in all instances. There is a fine balance between what a player is theoretically worth and the practical amount you need to pay to acquire his services.
The multiple eligibilities of players along with the corner, middle and utility designations cloud the picture. Who is to say every player eligible at both second and outfield are put at second? Doing this alters the number of players in each position’s draft‐worthy pool, skewing the composition of the replacement player which affects the number of relative useful stats each player contributes. The best way to combat this is to simplify your pool designation. In almost all leagues, the catcher pool needs to remain distinct. The first basemen and third basemen can be combined into a single corner infield pool. Similarly, second basemen and shortstops can be merged into the middle infield pool. This cuts down the total number of pools from 6 to 4. In addition, since many outfielders and corner infielders have eligibility in both pools, integrating those is perfectly acceptable as well. Now we only have 3 pools to deal with. Finally, partly due to the plethora of multiple eligibility players and the nature of the current player pool in general, in AL and NL only leagues and even some deeper mixed leagues, the replacement level player is so close to the same across all non‐catcher positions you can really simplify matter by using only a catcher and non‐catcher pool. All you need to do is lump the respective pools together and determine the replacement level player based on that new group.
NOTE: Since this essay was initially written, the inventory is such two pools are all that is necessary in most leagues: catcher and non-catcher. This is the manner the HITCVRC is currently programmed. The HITCVRC is the Customizable Value and Rankings Calculator, an excel program available for Platinum subscribers.
Another consideration is you may not feel it is practical to assign the same budget to each category. You may want to invest a higher portion to more stable categories. Perhaps this entails devaluing batting average and wins. Perhaps your league’s dynamics are such that speed or saves are devalued. You can readily adjust the budget you dedicate to steals or saves. The idea of devaluing speed makes sense from a theoretical aspect as well and is something we first discussed several years ago. Our value system assumes linear distribution of stats within the final standings. However, the reality is the spread between teams is not linear, especially in steals. We have conducted some studies that show you do not need to spend as much money in the steals category to finish at the same point in the category as you do others. We call this category efficiency and adjust our category weights accordingly, shunting some budget from steals to home runs. Why home runs? Site research demonstrates the category league champions fare the best in is homers, so it makes sense to help insure success there. In addition, the same studies show winning teams fare the poorest in steals, providing further evidence that it is practical to reduce steals allocation.
In Summary
As suggested in the introduction, the beauty of our system is it is flexible enough to easily handle these and any other practical alterations. The foundation is rooted by solid theoretical principles which can be modeled mathematically. So long as you understand the principles, you can adjust in any manner you deem reasonable to produce the most practical, hence useful set of bid guidelines possible. This is true for any size league with any positional requirements and any scoring categories. It can be adapted to keeper leagues. There is not a format we cannot handle. The key is understanding exactly what the value represents. It is not an (incorrect) measure of how many points you can gain in the standings with that player. It is not a measure of how many standard deviations a player is from an average player. It is the summed total of each player’s contribution of useful stats across each scoring category. We firmly believe this provides you with the optimal guidance to assist in your endeavor to assemble a championship team.
As mentioned, Mastersball Platinum has an Excel tool programmed to generate values using the PVM method. The original process involves iterative sorts until replacement stabilizes, something I am not skilled enough to program. Instead, I use the LARGE function to derive the replacement level player. As an example, in a 12-team league with two catchers, the replacement level for homers is the 24th highest total. The replacement for the rest of the pool is the 144th largest. This is subtracted from the rest of the pool to derive useful homers.
Another small tweak from the original method is using marginal pricing, since it's easy to program. Here, every player is assigned $1, since conventionally, that's the minimum required. The replacement player then earns $0.
Mathematically, in a 5x5 league, each player gets $0.20 marginal pricing for each category. As such, the cumulative marginal pricing needs to be removed from the category pool. Recall in a 12-team, 5x5 league, each hitting category distributes $430.56 to the draft-worthy pool. There are 168 hitters, assigned $33.60 marginal value. This is subtracted from $430.56, leaving $396.60 to be distributed to the useful stats in each category.
This process is done for all five categories, then each category contribution is summed for the final value. At this point, the pool probably isn't perfectly sized, so the program adjusts the prices proportionately, so they fit within the parameters and boundaries of the specific league.
The final change from the original method is an empirical discovery, unique to Mastersball. The research is available to Platinum subscribers and will soon be brought out from behind the firewall. Even with accounting for catcher scarcity, the pre-season values aren’t representative of what will transpire over the season. In short, the calculated scarcity bump is too severe. To deal with this, I’ve coded the CVRC to price backstops more realistically. Note, this is only true for two-catcher leagues.
Now for the grand finale. In the inaugural Mastersball Annual, John Mosey authored the valuation chapter. Mosey did a great job, but some readers had trouble understanding it, so I was tasked with translating the chapter into English for our second publication. Mosey was quite gracious and helpful throughout the process.
I was not alone in the endeavor, enlisting friend and colleague Rob Leibowitz, now proprietor of Rotoheaven to be my guinea pig and editor. Rob not only made sure my words were clear, he tested the steps of the method along the way.
For those inclined to download the chapter and try it out, I can’t promise much support. Things have changed for me professionally and I may not be able to guide you through as closely as a few years ago. I can, however, preach patience. A LOT of patience. Eventually, the replacement level will settle. After going through the process several times, you’ll probably figure out some tricks. But again, to get there, BE PATIENT. Feel free to post questions on the message forum.
With that, here’s the chapter on Player Valuation, circa 2002 (or so).
OK, back to 2020 Todd again. Unfortunately, I’m about 100 pounds heavier with less hair, and what’s left is more stubby gray than curly brown. However, I am a bit wiser and possess a deeper understanding of valuation.
Regardless of the method, valuation is seriously flawed. This will be the subject of future essays but realize every process has shortcomings. That said, I’m still most comfortable with the method just detailed. The key is understanding it’s limitations and applying that knowledge to your drafts and auctions.
As always, please post questions and comments on the site message forum. Admittedly, marketing is a weakness, but I’m often asked, “What do I get with Mastersball Platinum I can’t get elsewhere?” The answer is simple. You get me. Masterball Platinum is the only place you can communicate with me personally, where I’m happy to address anything fantasy baseball related.{jcomments on}
This is part of part of the Z-Book, an ongoing compilation of new and refreshed pieces. It's part of the 2020 Mastersball Platinum subscription, available for just $39.95, featuring the industry's earliest and most comprehensive set of player projections.
Todd Zola is the Primary Owner and Lead Content Provider for Mastersball. He’s the defending Great Fantasy Baseball Invitational champion, besting 314 of the industry’s finest. Todd is a former Tout Wars and LABR champion as well as a multi-time NFBC league winner.
- Details
- Written by: Todd Zola
- Category: Organized Chaos
The NFBC Cutline Championship is a points-based, best-ball scoring format. The leagues consist of ten teams and uses standard NFBC roster requirements and position eligibilities. There will be an initial snake draft to fill 42 roster spots then a pair of in-season FAAB periods. The first is April 7 with the final session on June 2. The regular season ends the Sunday before the All-Star break where teams will be entered into the Cutline Finals, Consolation Round or have their season end. More teams will be eliminated over the next nine weeks until a Cutline Champion is crowned in early September. For a complete description of the format, scoring and rules, click HERE.
SCORING
The Cutline scoring is designed so that the ranking of the players by points emulates the ranking via standard 5x5 rotisserie scoring. The correlation between points and 5x5 value is between .85 and .95 for hitters and pitchers.
A noteworthy difference between the Cutline and other NFBC contests is there isn’t a Friday transaction day for hitters. The scoring period for everyone runs from Monday through Sunday.
Points are awarded as follows:
Hitting
- Home Run: 6 points
- Stolen Base: 5 points
- Hit: 4 points
- Run: 2 points
- RBI: 2 points
- At-bat: -1 point
Pitching
- Win: 6 points
- Save: 8 points
- Inning Pitched: 3 points
- Strikeout: 1 point
- Hit or Walk Allowed: -1 point
- Earned Run Allowed: -2 points
BEST BALL
For those unfamiliar, best-ball scoring means your optimum lineup will be determined automatically each week without you ever setting a lineup. The only team management required is the initial draft and the two in-season FAAB periods. The NFBC site does the rest.
The intelligence is designed to account for corner infield, middle infield, utility and multiple position eligibility. There’s no delineation between starting pitchers and relievers – your top nine arms each week contribute to your total, regardless of their role. Shohei Ohtani can count as a hitter or pitcher; the site will determine how to deploy to maximize team points.
PROPER RANKING USING POINTS SCORING
As discussed, back-testing using previous season’s final stats was used to produce a system that correlates very well to 5x5 roto-scoring. That’s all well and good but it’s still essential to come up with a draft list incorporating principles intrinsic to points scoring.
If you play fantasy football you know where this going. The key to points leagues is rankings should not be based on raw points but rather adjusted points using the last player drafted at each position as a baseline. The idea is everyone in the league is credited with the number of points scored by the worst active player at each position so the person with that player essentially earns no useful points from that player.
Mathematically, find the worst draft-worthy player at each position, subtract those points from everyone at the position and re-rank according to those adjusted points.
Truth be told, this is by no means perfect, especially in a best-ball format. The calculation only works if one player occupies each roster spot all season – which is obviously not the case. In addition, the use of corner, middle, utility and players that are eligible for multiple positions skews the replacement level. Still, doing the best you can to determine replacement is better than ignoring it. Ultimately, draft flow comes down to varying expectations of player performance but having a starting point where, at minimum, the players are ranked accurately relative to each other is very beneficial.
HOW MASTERSBALL GENERATES CUTLINE RANKINGS
Let’s start with pitching. There are ten teams with nine roster spots so the expected points from the 90th highest total is subtracted from all the hurlers.
Hitting is where it gets dicey. Here’s what we know.
- Need 20 catchers
- Need 30 corner infielders, with a minimum of ten each at first and third
- Need 30 middle infielders, with a minimum of ten each at second and shortstop
- Need 50 outfielders
- Once those are all covered, need 10 highest left to be utility
With so many multiple eligibility players in today's game, position scarcity isn't a factor except at catcher. That is, using the 20th highest total for catcher and the 120th non-catcher for replacement, there's ample non-catchers to fill the above requirements so all 10 teams have a legal roster. Keep it simple, don’t overcomplicate, use two hitting pools, catcher and non-catcher.
GO BIG OR GO HOME
Before we go on to discuss some specific strategies, it’s necessary to set the proper mindset. Sure, there’s a league prize as the top-scorer in each ten-team league will pocket a nifty $250. Hopefully it’s obvious that the NFBC Cutline is a contest where you’re playing to win the whole kit and caboodle and not simply best nine others to net $100 or so. As such, you’re going to need to take some chances along with being clever about roster construction, taking advantage of the best ball aspect.
Taking chances means jumping players with higher ceilings up the rankings. This doesn’t mean players with limited ceilings should be ignored. It just means you’ll need to increase your risk profile to defeat the thousands of teams trying to win the Cutline Championship.
There are four subsets of players that generally carry the most risk:
- Young players with a limited track record
- Players with a track record coming off a career year
- Foreign players
- Players with an injury history
Can Marcus Semien and Yuli Gurriel sustain last season’s power spike? Can Fernando Tatis Jr. maintain such a high BABIP? Can Luis Robert be productive with poor plate skills? Can Chris Sale stay healthy? These are all legit concerns that may worry conservative drafters. Sorry, but caution will not take down the Cutline.
Neither Shogo Akiyama nor Yoshi Tsutsugo have swung at Major League pitch in anger yet. Kwang-Hyun Kim and Shun Yamaguchi haven’t thrown a pitch that counts in the bigs. Josh Lindblom has, but that was before honing his craft overseas. Sure, we’d like to see if they pass the eye test in the spring, but we don’t have that luxury. Risk averse players prefer to dance with the devil they know. Winning the Cutline requires venturing into the unknown.
Something to keep in mind is with best ball scoring, someone will always be there to backfill an injured player. Even though you risk carrying an empty roster spot, you won’t be getting a zero – you just have one fewer option to fill your best lineup.
Please don’t misinterpret the above and throw a dart at every pick. All I’m saying is you need to pick and choose instances to let your hair down and go outside your comfort zone.
TAKING ADVANTAGE OF BEST-BALL SCORING
Embrace variance
Consistency is a concept not all that relevant to standard rotisserie formats. You don’t care about the pathway; all you care about is a player’s season ending stats. However, the best-ball aspect of the Cutline affords several means to take advantage of the scoring to optimize your weekly scores. Embrace variance, especially with backups.
Every player has a baseline expectation but there are factors that can raise or lower that expectation over the course of a scoring period – at least on paper. The idea is there will be some weeks a handful of players exceed their baseline and will be included in your total while others they fall below, to be replaced by some other players in a positive situation that period. Hopefully, your backups are diversified and healthy so there will always be a few with an advantageous scenario.
Bully hitting, manage pitching
In standard roto, "bully hitting, manage pitching" entails focusing on bats early and drafting pitching later, then being smart with two-start guys and dominant middle relievers. Obviously, there isn't any in-season managing, but the idea can be deployed by stocking up on quality bats, virtually assured to produce enough to be in the best-ball lineup so you can draft extra pitchers hoping one pops. To be honest, this was more effective before off days were added to the schedule, availing more two-start weeks, but I personally feel it's still worthwhile.
To that end, when drafting "reserve" pitchers, a lesser starter on a better team is desired over a superior hurler for a weaker team. The scoring is designed to emulate 5x5 value which includes ratios and wins. You're looking for a couple of back-end pitchers to jump into your lineup, you don't care about ratio damage. It makes sense if a pitcher gets a win, his ERA and WHIP were decent that game. There are exceptions, but the main point is you're looking for a couple of guys to grab a win and jump into your active lineup that week.
Another pitching ploy is taking advantage of a closer bias. Many don't like taking closers, in part due to the volatility, but also because they're so reliant on saves. I like to steer into this skid and draft three or four closers I feel are fairly safe since saves often come in bunches. Again, it's best-ball, you're looking for an outlying performance to leap into the active lineup. There will be many weeks of no saves, but I want the ones with multiple. Having three of four closers increases the chance of having one pop.
Multiple position eligibility and utility
The more flexibility within your hitters, the fewer batters you need, freeing up more pitching darts. This is important for two reasons. First, pitchers spend more time on the IL so over the course of the season, the inventory dwindles. Second, the range of pitching scoring is wider than hitting (aided by two-start weeks) so you want as many pitchers as possible.
Here is a logical roadmap for roster construction:
- C-4
- 1B-3
- 2B-3
- 3B-3
- SS-3
- OF-10
- P-16
Every hitting position has two candidates for each roster spot. The problem is pitching is light. The way to combat this is multiple-eligibility hitters. For every player capable of filling more than one spot, you can add a pitcher. You don’t want to go overboard as injuries will also mount on the batting ledger, but at least four players providing roster flexibility are integral. Having a couple with dual IF/OF is extremely beneficial.
In a standard league where you set lineups, taking the inevitable discount on UT-only is a strong play. In best-ball, it isn't as beneficial. Without the UT-only, the expectation is one of the backups from the position player pool slides into UT each week. This doesn't mean avoid Nelson Cruz or Yordan Alvarez but drafting a UT-only costs one from the above framework. In order to maintain adequate pitching spots, flexibility in your batters is even more essential.
Ballparks with extreme park factors
Players get an inherent bump while at home. This is further embellished in good hitting venues. The key is realizing a home run park isn't always a run park. In general, you want power hitters in a home run park and all-around players in a park good for runs, hopefully in an above average offense.
Platoon hitters
This is more applicable to the later picks: tie goes to the lefty batter. On paper, having the platoon edge aids production. Approximately 72 percent of pitches are thrown by righthanded hurlers. On the average, four righthanders start in a six-game week while five righties start in a seven-game week. Everyone knows lefty swingers have the advantage in a platoon as they get more playing time. The key with best ball is weeks they face more righthanded pitching than an average period. Their baseline assumes four or five games against righty pitching. On paper, their production should exceed the baseline when facing more righties. Of course, this is balanced by weeks with more southpaws, but the overall approach is another batter will be in a favorable setup that week to spring into your active lineup.
Catchers
The primary reprecussion of proper ranking is catchers leap up the cheat sheet to the point J.T. Realmuto is a first round player. You dont have to take him that early, but rostering Realmuto gives you team a huge edge. Since he plays so much, you can wait a long time on your third and fourth catcher, or even wait on three more, hoping one pops each week. Obviously, you're sacrificing an early pick, but with best ball, the idea is someone will excel each week, so you won't feel the affect of not using that early spot elsewhere.
The only position where handcuffing makes sense is backstop, and only if the two teammates play a near equal amount each week. This is actually a great place to look since both have a chance to make the active lineup and if one gets hurt, the other prospers. Off-hand, Arizona (Carson Kelly/Stephen Vogt), Atlanta (Tyler Flower/Travis d'Arnaud), Washington (Kurt Suzuki/Yan Gomes) and maybe Oakland (Sean Murphy/Austin Allen) are plausible duos to target.
EARLY VERSUS LATE DRAFTS
The results have shown if there’s an advantage, it’s early drafts, which may be counter intuitive. However, drafting early allows you to get the players you favor more than the market before the market catches up. The perceived disadvantage is with FAAB since early drafters will be spending more during the first period to pick up the players emerging after their draft. But here’s the thing. All you need to do is make it through Week One with your initial 42. After that, the player pool is the same for all the leagues. Sure, the FAAB totals in your league may be less than leagues drafting later, but within your league, it’s all relative. Each league will be bidding on the in-season emerging players, other leagues will just be paying more for them since they didn’t spend as much of their budget early. Assuming you hung in there Week One, you’re not at a disadvantage to league’s drafting later.
MASTERSBALL RANKING AND DRAFT TRACKER
Platinum subscribers have access to the industry’s only combination rankings and draft tracker. The rankings are generated via the method discussed above. You can remove drafted players and they rankings automatically adjust. Available players are ranked in one overall list and by position, with players eligible at more than one spot highlighted for easy identification. For a tutorial on the software, click HERE.
Good luck and feel free to ask for clarification or pose follow-up questions on the Mastersball forum (access free to site registrants using the same username/password).{jcomments on}
This is part of part of the Z-Book, an ongoing compilation of new and refreshed pieces. It's part of the 2020 Mastersball Platinum subscription, available for just $39.95, featuring the industry's earliest and most comprehensive set of player projections.
Todd Zola is the Primary Owner and Lead Content Provider for Mastersball. He’s the defending Great Fantasy Baseball Invitational champion, besting 314 of the industry’s finest. Todd is a former Tout Wars and LABR champion as well as a multi-time NFBC league winner.
- Details
- Written by: Todd Zola
- Category: Organized Chaos
This is part of part of the Z-Book, an ongoing compilation of new and refreshed pieces. It's part of the 2020 Mastersball Platinum subscription, available for just $39.95, featuring the industry's earliest and most comprehensive set of player projections.
Welcome to the final installment of the Mastersball projection process, The Pitching Zystem. The general process hasn’t changed much since the last refresh of the method, however the projection for the individual skills has been improved.
Like with hitting, a three-year weighted average serves as the foundation, with MLEs (major league equivalencies) acting as a surrogate for Double-A and Triple-A performance. Unfortunately, the minor league data necessary for some of the skills regression of pitching isn’t as robust, so pertinent skills are regressed to league mean.
Hitting projections work off plate appearances, pitching revolves around batters faced (BF). Projecting walks, hit by pitch, sacrifices against and sacrifice files yield at bats. There’s science behind projecting walks; the others are based off history and have wide error bars, but the raw numbers are small, so the effect is minimal.
The four primary skills (homers, strikeouts, walks and hits) are all projected by using regressing actual to expected, with the default lever setting at 50% unless noted. This is then neutralized by applying park and aging factors.
HOME RUNS
The method is analogous to hitters, using average fly ball distance to discern expected homers. Actual homers allowed are regressed to expected, with the lever set at 75% actual, 25% expected to account for park factors. The projected homers are then neutralized using park and aging factors.
STRIKEOUTS
Apologies, I’m not sure who popularized this, but at this point it’s considered mainstream analysis. Swinging strike rate correlates well to strikeout rate. It’s not perfect, but it serves to unearth hurlers with the chance of increasing, or in some cases deceasing their punch outs. Each pitcher’s expected strikeouts are determined and regressed to actual, then neutralized.
WALKS
The excellent research staff at BaseballHQ.com found a similar relationship between the percent of balls thrown and walk percent. This is employed to calculate expected walks, regressed with actual and neutralized.
HITS
Hits are determined in an analogous manner to hitting, extrapolated from xBABIP (expected batting average on balls in play). Statcast data includes xBA (expected batting average) so xHits can be derived and plugged into the standard BABIP, using other xStats. Statcast data is neutralized by nature, so in order to regress it to actual BABIP, the components of BABIP must first be neutralized. The neutralized version is regressed to expected. From this, hits can be projected.
WHIP and ERA
WHIP can be determined directly from the projected stats after re-applying park factors and aging.
Even though there are some very elegant ERA estimators improving on the old school Gill and Reeve formula, I still use the antiquated method for a couple of reasons. Primarily, the inputs are hits, strikeouts, walks and homers, all projectable within reason, especially with the improved regression levers described above. The newer estimators utilize inputs with wider error bars, so any increased correlation is mitigated with added variance. Plus, the final ERA isn’t the expected ERA, but regressed to it based on the previous relationship between the pitcher’s actual ERA and Gill-Reeve xERA. At some point, I’d like to transition to a different xERA, but I’m not yet comfortable projecting some of the necessary components. Or maybe better said, the degree of accuracy of a new method isn’t sufficient to move off the simplicity of Gill-Reeve.
In lieu of a regression lever, final ERA is calculated using an index, comparing neutralized runs to expected runs (derived from Gill-Reeve). The projected ERA emanating from Gill Reeve using projected homers, strikeouts, walks and hits is then adjusted via the index. This bakes in allowances for regression and the ability for certain pitchers to over/underachieve their peripherals.
After each pitcher is projected, their LOB% (left on base percent) is compared to previous seasons. Some project LOB% and use that to yield ERA, I prefer to use LOB% as an eyeball litmus test. League average LOB% is around 72%. However, not all pitchers should be expected to regress towards that mean as some can outpitch the expectation. Ace starter and reliever can sport high LOB% levels. Starters can post marks in the 78% range while relievers can register levels in the mid-80s. I’ll look at the projected LOB%. If it doesn’t regress at least a little towards 72% (or higher for the elite), I’ll examine the projection and likely tweak the most logical regression lever, so the final projection is more sensical.
WINS/LOSSES
I’m seeing an increase in usage of iterations of this method, I wish I published it many moons ago when I first started employing it. Bill James developed a method to approximate team winning percentage using runs scored and runs allowed, termed Pythagorean Baseball Theorem since the formula resembles a2+b2=c2 for right triangles. It’s not perfect, but starter decisions correlate with innings so based on games started, the associated decisions can be secured. Using the pitcher’s ERA, adjusted to include unearned runs, his winning percentage can be found by including projected run support. Knowing winning percentage and decisions renders wins and losses. The same formula works or many relievers, however those used in higher leverage scenarios don’t enjoy the same chance for a win since they’re often entering the game with a lead, so the best they can do is log a save or hold. I’ve developed a tweak to the formula to account for this, applying it to all relievers projected for at least five combo saves and holds.
SAVES
Saves are not the crapshoot most believe. I’ve conducted studies showing the number of save opportunities correlates to team wins and ERA. Further, between 45%-55% of a team’s wins yield a save opportunity. Ergo, the starting point for save opportunities is 50% of team wins, estimated by the Pythagorean Theorem. Opportunities are then massaged in accordance with how the team’s projected ERA compares to league average. Relievers are assigned a percentage of save chances with converted saves projected using projected success rate.
HOLDS
I’ve looked, but to date I can’t find a method to scientifically project saves, so admittedly it’s a guesstimate based on team and player history.
MISCELLANEOUS
Ancillary stats such as wild pitches, pickoffs, hit batsmen, etc. are simply carried through the three-year weighted average without neutralization.
Thus completes the Mastersball Projection process. Please feel free to comment, critique or ask for clarification on the site message forum.{jcomments on}
Todd Zola is the Primary Owner and Lead Content Provider for Mastersball. He’s the defending Great Fantasy Baseball Invitational champion, besting 314 of the industry’s finest. Todd is a former Tout Wars and LABR champion as well as a multi-time NFBC league winner.
- Details
- Written by: Todd Zola
- Category: Organized Chaos
This is part of part of the Z-Book, an ongoing compilation of new and refreshed pieces. It's part of the 2020 Mastersball Platinum subscription, available for just $39.95, featuring the industry's earliest and most comprehensive set of player projections.
You’re going for a walk in the park and spot a lamp on a bench. You pick it up and rub it and a genie emerges, granting you one wish. You ask for the final MLB stats of everyone appearing in 2020. The genie says that’s too much. Instead, you can choose the slash line of all the hitters and the ratios for the pitchers or the number of plate appearances and innings pitched for everyone. Which do you choose?
An argument can be made for both. Choosing the slash/ratios indirectly hints at playing time. If the player’s numbers are good, they’re going to play and vice versa. Though, you won’t know if the player missed a significant portion of the season. Choosing the playing time covers the injury aspect, and hints at how well the guy played. More playing time than usual suggests better outcomes than expected. That said, you’re going to miss some big skills improvement from those already expected to play a lot.
Personally, the choice is clear. Give me the playing time. I’ll trade the Lucas Giolito breakout for knowing Giancarlo Stanton misses the entire season. Seeing Chris Paddack will throw 140.2 IP tells me he impressed in the spring and was able to maintain it over the season. After making the genie pinky-swear he wasn’t pulling my leg on Hyun-Jin Ryu’s 182.2 IP, I’d assume he pitched to his usual high level for essentially the full season.
I’ve been saying this for years. Doing your own projections is tedious and laborious. Unless you run a small business with projections as a major product, it’s, dare I write, unnecessary. The skills/production element of most sources are close. What differs is playing time. You want to do your own projections? Find a trusted source or two and season with your own playing time expectations. Voila, you have your own projections.
It’s my strong belief in the importance of playing time driving the diligence going into the Mastersball Platinum projections. Unfortunately, I haven’t gone for a walk in a park for a while, let alone happened upon a magic lamp. Plus, my crystal ball broke years ago and the replacement is still on back order.
What follows is a discussion of how I derive plate appearances and innings pitched. The actual mechanism is straightforward and will be detailed later. The more relevant talking points are my overall philosophy as it has matured over the years, differing greatly from when I first started doing this.
There was a time I chided projections systems over-projecting playing time, or not having the aggregate hits and runs from batters nearly match those given up by pitchers. It made perfect logical sense to me and I’m not going to admonish anyone still feeling that way. However, I am going to try to convince you it’s impractical, and a detriment to fantasy baseball prep.
The bottom line is, I can’t project injuries. Sure, there are some players with a health history warranting accounting for it in projections, but that’s only a piece of the injury pie. There are some players you just know are going to get 350-400 plate appearances. You don’t know when or where, they just are. I call this the Ty Wigginton rule. In order to make a team’s ledger balance, playing time must be taken away from some to allow the Ty Wiggintons to get theirs. Over time, I’ve learned this is counterproductive. I don’t know who is going to get hurt, or slump, but someone is and Wigginton is going to play. Taking playing time from a starter to make the math work unjustly lowers his ranking. I’d rather give Wigginton his portion and over project the rest. It renders a more practical projection set to build a team.
The same principle carries over for pitching. There are some swingmen virtually assured of some starts. It’s necessary to get a feel for how they’d perform, even if it means projecting 172 starts for the team. Shortchanging the starting five by two each unfairly lowers their innings, affecting their rank.
In full disclosure, playing early draft and hold leagues was the impetus for this change in approach. For those unaware, these are leagues with no in-season pickups by FAAB or waivers. The most common format is the National Fantasy Baseball Championship Draft Champions, with 15 teams and 50 roster spots. Fantrax also offers a similar setup. The point is, once you get into the second half of the draft, you’re drafting a lot of reserves, so it helps to have a practical sense of their potential contributions.
At this point, it’s fair to wonder if the playing time is more logical closer to the season. Yes and no. I’ll continue to include allowances for Ty Wigginton and his friends, but as some teams’ scenarios clear up, adjustments will be made. That is, I try to use common sense. Early on, it’s clear some teams have too many players for a spot while others are lacking. With respect to the former, if in my best judgment a player is going to be traded, I’ll project him for the playing time he’s likely to get on another team. Obviously, this is a guess, who knows what team, the role and the venue, but I’d rather do this than deprive the player of plate appearances, so his ranking is such he isn’t on the radar in Draft and Hold leagues. On the flip side, if it’s probable a team will bring someone else in for a position, I won’t force a player into that playing time. As opening day draws closer and either of these scenarios remain, I’ll do a mea culpa and assign playing time with the internal options.
The other point to discuss isn’t so much philosophy as it is mindset. When determining playing time, we tend to be optimistic for players we like, often younger, more established players. Not only are the rate stats aggressive, so is the volume. To help keep everything in perspective, here’s a refresh of a study I run every few years. I didn’t do the associated pitching version yet; look for that down the line.
The concept is looking at how many plate appearances batters within specified ranges garner the following season. To be eligible for the study, hitters needed consecutive seasons over 200 plate appearances. The following season’s result is classified as follows:
- 10 percent-plus more
- 5 to 10 percent more
- 5 to 7.5 percent more
- 5 to 5 percent more
- 5 percent less to 2.5 percent more (defined as the same)
- 5 to 5 percent less
- 5 to 7.5 percent less
- 5-10 percent less
- 10 percent-plus less
Eligible players are grouped in ranges of 25 plate appearances with the final one being 676-plus. The percentage of players falling within each of the above classifications is calculated. The study goes back to the 2015 season, so there’s four years of trials incorporated (2018-2019, 2017-2018, 2016-2017 and 2015-2016).
Before posting the results of the study, here's a table displaying the number of hitters in each playing time range. Please note some did not get included in the study if they didn't accrue over 200 plate appearances the ensuing campaign.
| PA | 2019 | 2018 | 2017 | 2016 | 2015 |
| 676+ | 21 | 23 | 19 | 33 | 20 |
| 651-675 | 20 | 13 | 16 | 14 | 24 |
| 626-650 | 12 | 15 | 25 | 24 | 14 |
| 601-625 | 16 | 20 | 17 | 17 | 23 |
| 576-600 | 15 | 22 | 13 | 16 | 12 |
| 551-575 | 11 | 14 | 18 | 12 | 17 |
| 526-550 | 23 | 17 | 23 | 18 | 13 |
| 501-525 | 17 | 20 | 13 | 12 | 20 |
| 476-500 | 21 | 15 | 23 | 11 | 15 |
| 451-475 | 13 | 24 | 13 | 17 | 18 |
| 426-450 | 15 | 18 | 19 | 20 | 20 |
| 401-425 | 23 | 13 | 17 | 9 | 15 |
| 376-400 | 11 | 15 | 13 | 12 | 18 |
| 351-375 | 23 | 18 | 18 | 17 | 18 |
| 326-350 | 22 | 16 | 17 | 20 | 7 |
| 301-325 | 10 | 15 | 23 | 15 | 14 |
| 276-300 | 28 | 16 | 12 | 20 | 14 |
| 251-275 | 18 | 17 | 18 | 20 | 29 |
| 226-250 | 27 | 19 | 13 | 20 | 18 |
| 201-225 | 14 | 24 | 17 | 25 | 22 |
Here is the table showing how qualifed batters ended up the next season.
RED: Percent fewer plate appearances
Yellow: Same plate appearances
GREEN: Percent more plate appearances
| PA | -10+ | -10 to -.7.5 | -7.5 to -5 | -5 to -2.5 | -2.5 to 2.5 | 2.5 to 5 | 5 to 7.5 | 7.5 to 10 | 10+ |
| 676+ | 35.9% | 7.6% | 7.6% | 10.9% | 29.3% | 6.5% | 2.2% | 0.0% | 0.0% |
| 651-675 | 41.5% | 6.2% | 3.1% | 7.7% | 24.6% | 7.7% | 6.2% | 1.5% | 1.5% |
| 626-650 | 42.1% | 5.3% | 5.3% | 7.9% | 13.2% | 10.5% | 6.6% | 3.9% | 5.3% |
| 601-625 | 52.1% | 4.1% | 5.5% | 4.1% | 15.1% | 6.8% | 4.1% | 4.1% | 4.1% |
| 576-600 | 46.6% | 5.2% | 3.4% | 5.2% | 5.2% | 6.9% | 8.6% | 6.9% | 12.1% |
| 551-575 | 50.0% | 0.0% | 0.0% | 3.7% | 9.3% | 5.6% | 5.6% | 5.6% | 20.4% |
| 526-550 | 42.6% | 8.2% | 3.3% | 0.0% | 9.8% | 3.3% | 3.3% | 11.5% | 18.0% |
| 501-525 | 38.8% | 0.0% | 4.1% | 4.1% | 12.2% | 6.1% | 6.1% | 0.0% | 28.6% |
| 476-500 | 33.9% | 3.6% | 5.4% | 5.4% | 7.1% | 5.4% | 1.8% | 7.1% | 30.4% |
| 451-475 | 39.3% | 1.6% | 3.3% | 3.3% | 11.5% | 4.9% | 3.3% | 3.3% | 29.5% |
| 426-450 | 28.8% | 0.0% | 3.0% | 3.0% | 6.1% | 3.0% | 3.0% | 3.0% | 50.0% |
| 401-425 | 40.0% | 2.5% | 2.5% | 0.0% | 7.5% | 2.5% | 2.5% | 0.0% | 42.5% |
| 376-400 | 32.6% | 0.0% | 4.7% | 2.3% | 0.0% | 2.3% | 2.3% | 4.7% | 51.2% |
| 351-375 | 29.8% | 6.4% | 2.1% | 2.1% | 4.3% | 2.1% | 0.0% | 0.0% | 53.2% |
| 326-350 | 18.6% | 4.7% | 2.3% | 2.3% | 4.7% | 2.3% | 4.7% | 2.3% | 58.1% |
| 301-325 | 15.8% | 0.0% | 2.6% | 5.3% | 2.6% | 2.6% | 5.3% | 2.6% | 63.2% |
| 276-300 | 15.2% | 3.0% | 3.0% | 0.0% | 3.0% | 9.1% | 3.0% | 3.0% | 60.6% |
| 251-275 | 10.8% | 8.1% | 2.7% | 0.0% | 2.7% | 5.4% | 5.4% | 0.0% | 64.9% |
| 226-250 | 6.1% | 0.0% | 3.0% | 3.0% | 3.0% | 0.0% | 3.0% | 0.0% | 81.8% |
| 201-225 | 0.0% | 0.0% | 0.0% | 4.8% | 0.0% | 0.0% | 4.8% | 2.4% | 88.1% |
Before reviewing the data, this isn’t mean to be anything more than a guideline. The results are not factored into projections to have last season’s playing time match this. That said, it does offer a good overview.
To that end, there’s a flaw in the data that I should have had the foresight to consider, but it doesn’t affect the analysis. The plate appearances are not normalized for the offensive environment. That is, more runs were scored in 2019 than ever before. It stands to reason the aggregate plate appearances were also an all-time high. Batters playing the same number of games the past two seasons had more trips to the dish last year, assuming they maintained their spot in the batting order. Again, while this is a bug, it doesn’t alter the observations.
The biggest takeaway, especially at the top, is batters are much more likely to incur a decline in playing time, often a large one. For what it’s worth, this held true last season, despite the increase in runs. Between a quarter and a third of the highest volume players repeat the previous season’s plate appearances while just a handful enjoy more. If you expect more than seven or eight of the players eclipsing 676 plate appearances last season to repeat, you’re too aggressive. If you have more than two or three with increased playing time, you are way to optimistic.
The elegance of studies like this is everyone can interpret the data in their own manner. I’ll talk about other applications for the Platinum subscribers down the line.
With that as a backdrop, here is the Mastersball process for projecting playing time.
Two side-by-side grids are set up. The first projects the percent of time each player spends at a position. The second projects the percent each hits in that spot in the order. It’s the latter driving playing time.
A target number of plate appearances for each spot in the order for every team is determined from the last three years. By means of example, if the target for the leadoff spot is 753 PA and a player is projected to hit in the top spot 90% of the time, his PA are 753 x .9 or 678 PA.
Players can be projected to hit in multiple spots, Excel takes care of the dirty work. I set the sheet up to make sure the first balances with the second, as well as highlighting overages and insufficient playing time. The elegance is in its simplicity. Even though I eschewed overall logic earlier, each individual player is quite logical. The San Francisco Giants leadoff hitter projected to receive 90% of the plate appearances won’t get as many as a similar guy from the Houston Astros or New York Yankees.
Here's a typical team, the current grid for the Boston Red Sox:
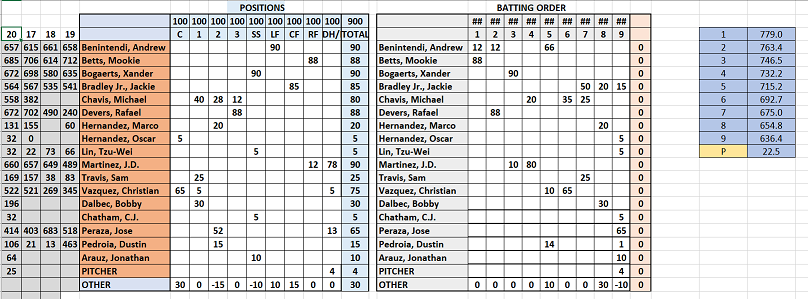
In brief, pitching is done in a similar manner, though only one grid is needed. The projected innings per start is determined, then the number of starts are projected, resulting in the innings estimate. As discussed, the goal is 162 starts, but it's not forced. Innings for relievers are projected by hand.
There you have it friends, the Mastersball playing time projection process. I take pride in updating it weekly, perhaps more when required. As always, I'm happy to address any questions, preferably on the site forum.
Todd Zola is the Primary Owner and Lead Content Provider for Mastersball. He’s the defending Great Fantasy Baseball Invitational champion, besting 314 of the industry’s finest. Todd is a former Tout Wars and LABR champion as well as a multi-time NFBC league winner.