This is part of part of the Z-Book, an ongoing compilation of new and refreshed pieces. It's part of the 2020 Mastersball Platinum subscription, available for just $39.95, featuring the industry's earliest and most comprehensive set of player projections.
You’re going for a walk in the park and spot a lamp on a bench. You pick it up and rub it and a genie emerges, granting you one wish. You ask for the final MLB stats of everyone appearing in 2020. The genie says that’s too much. Instead, you can choose the slash line of all the hitters and the ratios for the pitchers or the number of plate appearances and innings pitched for everyone. Which do you choose?
An argument can be made for both. Choosing the slash/ratios indirectly hints at playing time. If the player’s numbers are good, they’re going to play and vice versa. Though, you won’t know if the player missed a significant portion of the season. Choosing the playing time covers the injury aspect, and hints at how well the guy played. More playing time than usual suggests better outcomes than expected. That said, you’re going to miss some big skills improvement from those already expected to play a lot.
Personally, the choice is clear. Give me the playing time. I’ll trade the Lucas Giolito breakout for knowing Giancarlo Stanton misses the entire season. Seeing Chris Paddack will throw 140.2 IP tells me he impressed in the spring and was able to maintain it over the season. After making the genie pinky-swear he wasn’t pulling my leg on Hyun-Jin Ryu’s 182.2 IP, I’d assume he pitched to his usual high level for essentially the full season.
I’ve been saying this for years. Doing your own projections is tedious and laborious. Unless you run a small business with projections as a major product, it’s, dare I write, unnecessary. The skills/production element of most sources are close. What differs is playing time. You want to do your own projections? Find a trusted source or two and season with your own playing time expectations. Voila, you have your own projections.
It’s my strong belief in the importance of playing time driving the diligence going into the Mastersball Platinum projections. Unfortunately, I haven’t gone for a walk in a park for a while, let alone happened upon a magic lamp. Plus, my crystal ball broke years ago and the replacement is still on back order.
What follows is a discussion of how I derive plate appearances and innings pitched. The actual mechanism is straightforward and will be detailed later. The more relevant talking points are my overall philosophy as it has matured over the years, differing greatly from when I first started doing this.
There was a time I chided projections systems over-projecting playing time, or not having the aggregate hits and runs from batters nearly match those given up by pitchers. It made perfect logical sense to me and I’m not going to admonish anyone still feeling that way. However, I am going to try to convince you it’s impractical, and a detriment to fantasy baseball prep.
The bottom line is, I can’t project injuries. Sure, there are some players with a health history warranting accounting for it in projections, but that’s only a piece of the injury pie. There are some players you just know are going to get 350-400 plate appearances. You don’t know when or where, they just are. I call this the Ty Wigginton rule. In order to make a team’s ledger balance, playing time must be taken away from some to allow the Ty Wiggintons to get theirs. Over time, I’ve learned this is counterproductive. I don’t know who is going to get hurt, or slump, but someone is and Wigginton is going to play. Taking playing time from a starter to make the math work unjustly lowers his ranking. I’d rather give Wigginton his portion and over project the rest. It renders a more practical projection set to build a team.
The same principle carries over for pitching. There are some swingmen virtually assured of some starts. It’s necessary to get a feel for how they’d perform, even if it means projecting 172 starts for the team. Shortchanging the starting five by two each unfairly lowers their innings, affecting their rank.
In full disclosure, playing early draft and hold leagues was the impetus for this change in approach. For those unaware, these are leagues with no in-season pickups by FAAB or waivers. The most common format is the National Fantasy Baseball Championship Draft Champions, with 15 teams and 50 roster spots. Fantrax also offers a similar setup. The point is, once you get into the second half of the draft, you’re drafting a lot of reserves, so it helps to have a practical sense of their potential contributions.
At this point, it’s fair to wonder if the playing time is more logical closer to the season. Yes and no. I’ll continue to include allowances for Ty Wigginton and his friends, but as some teams’ scenarios clear up, adjustments will be made. That is, I try to use common sense. Early on, it’s clear some teams have too many players for a spot while others are lacking. With respect to the former, if in my best judgment a player is going to be traded, I’ll project him for the playing time he’s likely to get on another team. Obviously, this is a guess, who knows what team, the role and the venue, but I’d rather do this than deprive the player of plate appearances, so his ranking is such he isn’t on the radar in Draft and Hold leagues. On the flip side, if it’s probable a team will bring someone else in for a position, I won’t force a player into that playing time. As opening day draws closer and either of these scenarios remain, I’ll do a mea culpa and assign playing time with the internal options.
The other point to discuss isn’t so much philosophy as it is mindset. When determining playing time, we tend to be optimistic for players we like, often younger, more established players. Not only are the rate stats aggressive, so is the volume. To help keep everything in perspective, here’s a refresh of a study I run every few years. I didn’t do the associated pitching version yet; look for that down the line.
The concept is looking at how many plate appearances batters within specified ranges garner the following season. To be eligible for the study, hitters needed consecutive seasons over 200 plate appearances. The following season’s result is classified as follows:
- 10 percent-plus more
- 5 to 10 percent more
- 5 to 7.5 percent more
- 5 to 5 percent more
- 5 percent less to 2.5 percent more (defined as the same)
- 5 to 5 percent less
- 5 to 7.5 percent less
- 5-10 percent less
- 10 percent-plus less
Eligible players are grouped in ranges of 25 plate appearances with the final one being 676-plus. The percentage of players falling within each of the above classifications is calculated. The study goes back to the 2015 season, so there’s four years of trials incorporated (2018-2019, 2017-2018, 2016-2017 and 2015-2016).
Before posting the results of the study, here's a table displaying the number of hitters in each playing time range. Please note some did not get included in the study if they didn't accrue over 200 plate appearances the ensuing campaign.
| PA | 2019 | 2018 | 2017 | 2016 | 2015 |
| 676+ | 21 | 23 | 19 | 33 | 20 |
| 651-675 | 20 | 13 | 16 | 14 | 24 |
| 626-650 | 12 | 15 | 25 | 24 | 14 |
| 601-625 | 16 | 20 | 17 | 17 | 23 |
| 576-600 | 15 | 22 | 13 | 16 | 12 |
| 551-575 | 11 | 14 | 18 | 12 | 17 |
| 526-550 | 23 | 17 | 23 | 18 | 13 |
| 501-525 | 17 | 20 | 13 | 12 | 20 |
| 476-500 | 21 | 15 | 23 | 11 | 15 |
| 451-475 | 13 | 24 | 13 | 17 | 18 |
| 426-450 | 15 | 18 | 19 | 20 | 20 |
| 401-425 | 23 | 13 | 17 | 9 | 15 |
| 376-400 | 11 | 15 | 13 | 12 | 18 |
| 351-375 | 23 | 18 | 18 | 17 | 18 |
| 326-350 | 22 | 16 | 17 | 20 | 7 |
| 301-325 | 10 | 15 | 23 | 15 | 14 |
| 276-300 | 28 | 16 | 12 | 20 | 14 |
| 251-275 | 18 | 17 | 18 | 20 | 29 |
| 226-250 | 27 | 19 | 13 | 20 | 18 |
| 201-225 | 14 | 24 | 17 | 25 | 22 |
Here is the table showing how qualifed batters ended up the next season.
RED: Percent fewer plate appearances
Yellow: Same plate appearances
GREEN: Percent more plate appearances
| PA | -10+ | -10 to -.7.5 | -7.5 to -5 | -5 to -2.5 | -2.5 to 2.5 | 2.5 to 5 | 5 to 7.5 | 7.5 to 10 | 10+ |
| 676+ | 35.9% | 7.6% | 7.6% | 10.9% | 29.3% | 6.5% | 2.2% | 0.0% | 0.0% |
| 651-675 | 41.5% | 6.2% | 3.1% | 7.7% | 24.6% | 7.7% | 6.2% | 1.5% | 1.5% |
| 626-650 | 42.1% | 5.3% | 5.3% | 7.9% | 13.2% | 10.5% | 6.6% | 3.9% | 5.3% |
| 601-625 | 52.1% | 4.1% | 5.5% | 4.1% | 15.1% | 6.8% | 4.1% | 4.1% | 4.1% |
| 576-600 | 46.6% | 5.2% | 3.4% | 5.2% | 5.2% | 6.9% | 8.6% | 6.9% | 12.1% |
| 551-575 | 50.0% | 0.0% | 0.0% | 3.7% | 9.3% | 5.6% | 5.6% | 5.6% | 20.4% |
| 526-550 | 42.6% | 8.2% | 3.3% | 0.0% | 9.8% | 3.3% | 3.3% | 11.5% | 18.0% |
| 501-525 | 38.8% | 0.0% | 4.1% | 4.1% | 12.2% | 6.1% | 6.1% | 0.0% | 28.6% |
| 476-500 | 33.9% | 3.6% | 5.4% | 5.4% | 7.1% | 5.4% | 1.8% | 7.1% | 30.4% |
| 451-475 | 39.3% | 1.6% | 3.3% | 3.3% | 11.5% | 4.9% | 3.3% | 3.3% | 29.5% |
| 426-450 | 28.8% | 0.0% | 3.0% | 3.0% | 6.1% | 3.0% | 3.0% | 3.0% | 50.0% |
| 401-425 | 40.0% | 2.5% | 2.5% | 0.0% | 7.5% | 2.5% | 2.5% | 0.0% | 42.5% |
| 376-400 | 32.6% | 0.0% | 4.7% | 2.3% | 0.0% | 2.3% | 2.3% | 4.7% | 51.2% |
| 351-375 | 29.8% | 6.4% | 2.1% | 2.1% | 4.3% | 2.1% | 0.0% | 0.0% | 53.2% |
| 326-350 | 18.6% | 4.7% | 2.3% | 2.3% | 4.7% | 2.3% | 4.7% | 2.3% | 58.1% |
| 301-325 | 15.8% | 0.0% | 2.6% | 5.3% | 2.6% | 2.6% | 5.3% | 2.6% | 63.2% |
| 276-300 | 15.2% | 3.0% | 3.0% | 0.0% | 3.0% | 9.1% | 3.0% | 3.0% | 60.6% |
| 251-275 | 10.8% | 8.1% | 2.7% | 0.0% | 2.7% | 5.4% | 5.4% | 0.0% | 64.9% |
| 226-250 | 6.1% | 0.0% | 3.0% | 3.0% | 3.0% | 0.0% | 3.0% | 0.0% | 81.8% |
| 201-225 | 0.0% | 0.0% | 0.0% | 4.8% | 0.0% | 0.0% | 4.8% | 2.4% | 88.1% |
Before reviewing the data, this isn’t mean to be anything more than a guideline. The results are not factored into projections to have last season’s playing time match this. That said, it does offer a good overview.
To that end, there’s a flaw in the data that I should have had the foresight to consider, but it doesn’t affect the analysis. The plate appearances are not normalized for the offensive environment. That is, more runs were scored in 2019 than ever before. It stands to reason the aggregate plate appearances were also an all-time high. Batters playing the same number of games the past two seasons had more trips to the dish last year, assuming they maintained their spot in the batting order. Again, while this is a bug, it doesn’t alter the observations.
The biggest takeaway, especially at the top, is batters are much more likely to incur a decline in playing time, often a large one. For what it’s worth, this held true last season, despite the increase in runs. Between a quarter and a third of the highest volume players repeat the previous season’s plate appearances while just a handful enjoy more. If you expect more than seven or eight of the players eclipsing 676 plate appearances last season to repeat, you’re too aggressive. If you have more than two or three with increased playing time, you are way to optimistic.
The elegance of studies like this is everyone can interpret the data in their own manner. I’ll talk about other applications for the Platinum subscribers down the line.
With that as a backdrop, here is the Mastersball process for projecting playing time.
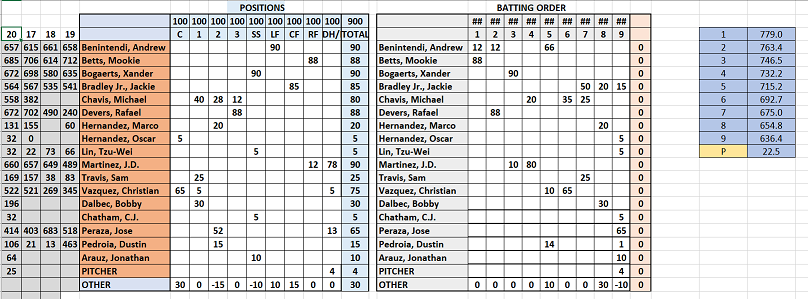
Two side-by-side grids are set up. The first projects the percent of time each player spends at a position. The second projects the percent each hits in that spot in the order. It’s the latter driving playing time.
A target number of plate appearances for each spot in the order for every team is determined from the last three years. By means of example, if the target for the leadoff spot is 753 PA and a player is projected to hit in the top spot 90% of the time, his PA are 753 x .9 or 678 PA.
Players can be projected to hit in multiple spots, Excel takes care of the dirty work. I set the sheet up to make sure the first balances with the second, as well as highlighting overages and insufficient playing time. The elegance is in its simplicity. Even though I eschewed overall logic earlier, each individual player is quite logical. The San Francisco Giants leadoff hitter projected to receive 90% of the plate appearances won’t get as many as a similar guy from the Houston Astros or New York Yankees.
Here's a typical team, the current grid for the Boston Red Sox:
In brief, pitching is done in a similar manner, though only one grid is needed. The projected innings per start is determined, then the number of starts are projected, resulting in the innings estimate. As discussed, the goal is 162 starts, but it's not forced. Innings for relievers are projected by hand.
There you have it friends, the Mastersball playing time projection process. I take pride in updating it weekly, perhaps more when required. As always, I'm happy to address any questions, preferably on the site forum.
Todd Zola is the Primary Owner and Lead Content Provider for Mastersball. He’s the defending Great Fantasy Baseball Invitational champion, besting 314 of the industry’s finest. Todd is a former Tout Wars and LABR champion as well as a multi-time NFBC league winner.