This is a simple game. You project the player, you rank the player, you draft the player.
With a hat-tip to Durham Bulls Manager Skip Riggins, that’s fantasy baseball in a nutshell. Sure, there are a plethora of formats with all sorts of rules. Regardless, it all begins with how one feels a player will perform.
Player expectations aren’t all formulaic. To be honest, most aren’t. They aren’t all a specific stat line either. Some simply frame a guy as about .280 with 20-something homers and 80-90 runs with similar RBI plus a handful of steals in around 500 at bats.
Call it a projection, an expectation, or whatever you want. If you play fantasy baseball, everything is based on how you feel everyone will perform.
Personally, I prefer using an algorithm-driven method. It’s proven effective and it’s my nature. The key is understanding the limitations and not being married to the result. It’s not the projection itself, it’s what you do with it. To be honest, my projection of .282 with 24 HR, 83 RBI, 86 runs and 4 SB in 517 at bats isn’t any better than that referenced earlier. I know that and believe it. Yet, I strive to produce the best foundation for drafting in the industry.
I see a projection as an average of all plausible outcomes. One way to look at it is the average of all outcomes if a season were played a gazillion times. These would include some instances the player getting hurt opening day and others where he plays nearly every game. Over a gazillion years, a lot can happen.
Here’s an example, albeit oversimplified.
A. 5% chance the player gets hurt early
.284 with 5 HR, 16 RBI, 17 runs and a steal in 100 AB
B. 15% chance the player has a career year and gets more playing time than ever
.298 with 35 HR, 108 RBI, 110 runs and 7 SB in 625 AB
C. 30% chance the player has an IL stint or two, with lower than normal numbers
.269 with 19 HR, 69 RBI, 72 runs and 3 SB in 478 AB
D. 50% chance the player comes close to the last couple of season’s numbers
.285 with 26 HR, 91 RBI, 94 runs and 4 SB in 550 AB
Determining the weighted average of the above yields the exact line mentioned above: .282 with 24 HR, 83 RBI, 86 runs, 4 SB in 517 AB.
Even this simple example illustrates why the projection is only the starting point. Some touch-and-feel drafters may have an inkling on the player and are willing to pay for B, the career year scenario. Someone else may not weigh the downside risk of A and C and pay for D, which is a bit better than the final projection which factors in the risk.
You’re not drafting the projection; you’re drafting the player with a wide range of plausible outcomes. For me, it’s about knowing what the projection represents and applying that contextually to team needs.
There will be some instances where I’ll be willing to bet on the come and jump the player up my cheat sheet. The above isn’t the ideal example, but for a more injury prone player, I may hedge more towards the lower playing time outcomes and require a decent discount at the draft table. It all depends on my team at the time, or maybe general strategy I wish to deploy.
A winning team is all about balance. Most think of power versus speed or hitting versus pitching in this realm. The balance here is paying for the 90th percentile projection versus needing a discount to invest. Both types of players contribute to a winning roster, with the fulcrum often being league context.
Many fantasy baseball enthusiasts say the reason they don’t do their own projections is not having enough time. What they really mean is the reason they don’t do their own spreadsheet/database driven projections is time. As explained, if you draft a player, you did it based on some level of expectation.
There’s a simple way one can generate their own projections. While there will be skills differences between different sources of projections, they’ll usually all be in the same ballpark. The source of the numbers may disagree, but they’re within the variance intrinsic to the process.
Playing time is the differentiator. Do you want to generate your own projections? Assemble a couple of different sets and drill each stat down to per PA and or per IP, then season with your own estimation of PA or IP. Voila, you have your own projection!
The caveat is, everyone (including yours truly) usually over projects playing time if the model is the average of a gazillion seasons. That said, if everyone is assumed to play more than they should, the relative ranking for fantasy purposes doesn’t change. What changes is the delta between the players, not the order. Generally, the players at the top are assigned more playing time than they should. The effect is more downside risk, more relevant in an auction when you can plan accordingly. In a draft you’re forced to take on the risk at the top. Though, a compiler (someone as much, if not more reliant on volume than skills) can leapfrog a higher skilled player with adequate playing time.
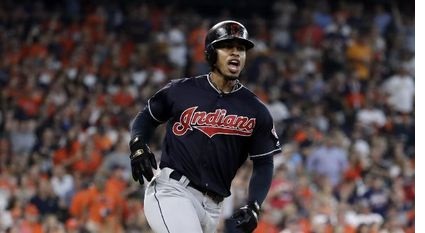 This example was better before this past season, but Francisco Lindor was the perfect player to cite. In his first three full years, Lindor played an average of 158 games, amassing 684 PA in 2016, followed by 723 then 745. It’s extremely rare to repeat 700-plus PA campaigns, much less three-peat. Yet, we all pegged Lindor for another 700-something in 2019. Of course, Lindor was injured early and finished with “only” 654. He was also hurt before the bulk of drafts so it could be considered. What if he got hurt the first week of the season instead? His ranking incorporated the huge level of PA. The key with Lindor is while his skills are obviously excellent, he’s still a compiler, needing volume for top-5 or top-10 ranking. Giving Mike Trout, Ronald Acuna Jr. or Christian Yelich that level of plate appearances makes them $55-plus players.
Note: Look for a refresh of a piece I did on projecting playing time to be posted soon
Future chapters will detail the Mastersball Projection Process. Hopefully this provides a backdrop for a projection and how to look at it when assembling a roster.
This is part of part of the Z-Book, an ongoing compilation of new and refreshed pieces. It's part of the 2020 Mastersball Platinum subscription, available for just $39.95, featuring the industry's earliest and most comprehensive set of player projections.