Several years ago, I introduced the concept of Category Efficiency Rankings (CER). The notion didn’t gain traction so it was abandoned. The idea involved massaging a conventional valuation set to render it more practical.
Fueling the move away from CER was a deeper understanding winning was less about pinpoint valuation and more about game theory and roster construction. Valuation shouldn’t be thought of in absolute, but rather in relative terms. Introducing a means of fine-tuning valuation simultaneous with preaching a more abstract drafting approach was confusing. Why do I have to think if CER does it for me?
Before delving into why it’s time to bring CER out of hibernation, let’s review valuation theory in general terms. Valuation is the process whereby a player projection is assigned a dollar value, ostensibly to be used in auctions, but also to proxy as a cheat sheet for drafts via ranking players by descending value.
There are three primary systems. We employ the Percentage Value Method (PVM). PVM distributes dollars in proportion to the players’ contributions to the respective categories. The most popular process is Standings Gained Points (SGP). Here, money is assigned relative to how each player helps a team earn points in each category. The last procedure uses standard deviations (SD). The player’s expectation is scored based on how many standard deviations it is from the mean of each category, then budget is distributed as a percentage of the player’s summed standard deviations across all categories to those of the field.
Regardless of the method, valuation is flawed. Plus, an output is only as good as its input, and the error bar associated with player projections is estimated around 30 percent. The dollar value is not only a function of the player’s projections, but also encompasses that of replacement level players and the cumulative contributions of the draft-worthy field. It’s plausible to nail a player’s projection but to miss on the dollar value if the other factors are off. As mentioned, my preference is for PVM. SGP is intrinsically flawed while SD lacks a theoretical basis.
The flaws with SGP pertain to the non-linear nature of each category. If it takes 5 units of a stat to gain a point in that category based on average standings and the player projects to producing 20 units, they are assigned four SGP (20/5). However, when you add up the SGP for each category, they’re all different. All categories count the same, therefore an equal number of SGP should correspond to each.
The discrepancy emanates from the uneven, top to bottom distribution in the categories. The lowest team gets one point. To earn more, other teams need to eclipse this barrier. Let’s define barrier SGP as the last place total divided by the units necessary to gain a point in that category. If stats were evenly distributed, the barrier SGP would be the same across the board, but they’re not. Typically, the barrier SGP for stolen bases is much lower than the other hitting categories (the same for saves in pitching) skewing the balance. While this is a flaw with the system, as will be explained later, it serendipitously acts in a positive manner. Still, I have an issue endorsing a method that’s right for the wrong reasons.
The SD method exhibits the same downfall as SGP; the sum of the SD per category aren’t consistent. In addition, while the SGP method has an elegance in its genesis, there’s no theoretical basis between standard deviations and the extent the player helps a team succeed.
PVM is far from perfect, but at least the theoretical foundation and math make sense. Other than the flaws inherent to all methods, the primary shortcoming of PVM is while value is allocated proportionately, spending the same amount in each category doesn’t result in equal points in each. The reason is the unequal distribution of stats within the categories.
They say a picture is worth a thousand words so let’s use an image to illustrate the above. Data from the 2016 National Fantasy Baseball Championship Main Event will be employed. These are 15-team, mixed leagues with no trading so the player pool is as homogenous as possible. Results from 30 leagues were used to determine average standings. That is, the average total was calculated per category for each standings place.
The key is converting average standings to normalized standings. The entails assigning each category an equal number of units, we’ll use 1000. The average stats at each standings point are scaled so the sum of the 15 spots is 1000 for each. Here’s the plot:
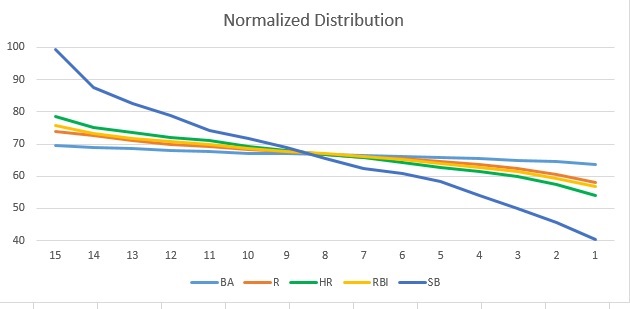
As suggested, the last place team in stolen bases has fewer units relative to the other categories. As one may intuit, runs and RBI track closely. Homers have the second lowest last-place barrier but it’s significantly higher than steals. Most noteworthy is the flatness of the batting average distribution. This will be of utmost importance when we get to CER adjustments.
Let’s save another 1000 words to graphically display how spending the same amount in each category yields a different number of points. Here, the budget allotted for each hitting category is computed based on conventional valuation methods. The standard budget is $260. While this differs by league, on the average, 69 percent of the budget is spent on hitting. These leagues have 15 teams with five categories so the amount dedicated per hitting category is $260 x 15 x .69 / 5 = $538.20.
Similar to categorical stats being normalized to 1000 units, they can be normalize to $538.20 showing how many points should be earned by spending a specific amount:
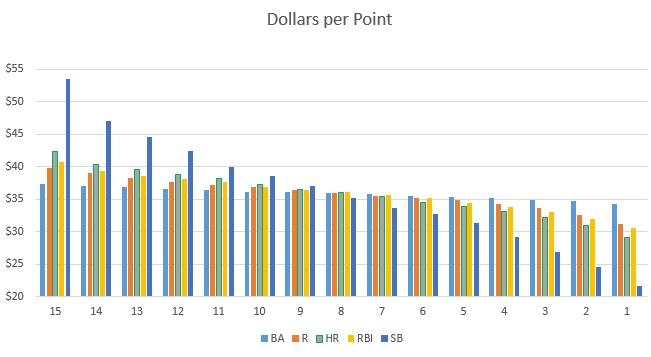
Keep in mind we’re all looking for a positive return on our investment, so if we spend, say, $36 in a category we’re hoping to accrue over $40 worth of points. Still, either you need to spend a lot more or get a huge profit in steals to finish in the upper third of the standings. This is relevant since league champions generally amass 115-125 points, an average of 11.5 to 12.5 in each category.
The $36 above wasn’t arbitrary. Distilled down to the team level, equal spending per category amounts to $35.88 each. Not-so-coincidentally, that lands at the midpoint in the standings per category, hence the obvious need to derive profit to win. For what it’s worth, it usually takes $320 worth of stats to drive down victory lane
Relating this to CER, doesn’t it make sense to allocate more budget to homers? Adding $3 to homers yields 13 points while subtracting $3 from steals renders 6 points for a total of 19. Equal spending returns 16 points. Again, profit is expected regardless of the amount spent. But even that favors funneling budget away from steals and to homers. The landing in steals is just past where points between adjacent teams is greater. On the other end, just a little profit in homers earns 14 or 15 points, along with contributing to runs, RBI and even batting average, something relevant that hasn’t been broached yet.
Speaking of batting average, look at how little money separates first and last place, barely $3. Plus, batting average is the most unpredictable category as there’s more variance. Shunting budget from average may not even sacrifice points if one or two hitters get a little lucky with batting average on balls in play. Truth be told, aiming for a low average in lieu of more counting stats is a common ploy. The above chart lends credence to the tactic.
There are two more reasons favoring drafting homers in lieu of steals. The first is the way league champions fared across the hitting categories. Here’s the average number of points the 30 league winners totaled in each of the hitting categories:
| BA | R | HR | RBI | SB |
| 11 | 13.1 | 12.9 | 13.1 | 11.9 |
Victors scored highest in runs, homers and RBI, a full standing place higher than steals and two more than batting average. This is in perfect sync with the conclusion drawn from the charts above; spend more on homers, take away from steals and batting average.
The other justification takes advantage of what’s available in season. Traditionally, more stolen bases than homers are added via free agents. One way to show this is comparing drafted stats to season-ending numbers. Using the NFBC Main Event, the stats derived from treating opening-day rosters as a draft-and-hold, then comparing those totals to actual final numbers, historically 90 percent of homers are acquired on draft day, in contrast to 85 percent of swipes. It’s not much of a difference, but is sufficient rationale to focus more on homers at the draft table.
Pulling things together, there are three viable reasons to devote more draft-day attention to homers at the expense of steals:
- Category distribution
- Champions fare better in homers
- More steals are available for in-season acquisition
Those with extensive experience can likely assemble a quality squad without CER adjustments. But why not get a nudge from more practical rankings?
Before addressing that question, let’s circle back to the contention that SGP, and to a lesser extent SD, are right for the wrong reasons. Here’s the 2016 end-of-season earnings for the top hitters per each system:
| PVM | SGP | SD | |
| Mookie Betts | $43 | $41 | $42 |
| Jose Altuve | $41 | $38 | $40 |
| Mike Trout | $40 | $39 | $39 |
| Jonathan Villar | $39 | $34 | $31 |
| Paul Goldschmidt | $34 | $33 | $32 |
| Jean Segura | $34 | $30 | $31 |
| Charlie Blackmon | $33 | $31 | $33 |
| Nolan Arenado | $32 | $35 | $35 |
| Kris Bryant | $31 | $32 | $32 |
| Brian Dozier | $30 | $31 | $29 |
The pair to focus on are Jonathan Villar and Nolan Arenado. Note how much higher PVM places the stolen base leader Villar while lagging on Arenado, who swiped only two to complement his 41 homers. Serendipitously, SGP accounts for the three bullet points above.
Now consider that SGP is the most popular valuation process so most of your league-mates will be guided by SGP ranks. Experienced players intuitively know to go the extra buck on sluggers like Arenado and be careful with speedsters like Villar or their team will suffer a paucity of power in lieu of a surplus of speed.
Until recently, I opted to direct writing energy towards this Zen style of drafting, rooted in numbers and analysis but with an overall awareness of team construct. While this is still largely the manner I’ll draft, there’s a tangible benefit to utilizing CER. Hence, the decision to relaunch the concept, in hopes this time it germinates.
Two obvious questions are now on the table. What should the adjusted category weights be and what about leagues of different size and format? Let’s work backwards.
All the described trends transcend standard 5x5 leagues. The categorical distributions are slightly different, but in the abstract, the same three reasons supporting CER for 15-team mixed leagues hold true in all leagues.
That leaves the big question, how should the hitting budget be allocated for most efficient spending? Unfortunately, there isn’t a one-size-fits-all answer. Plus, remember values and ranks are still just a guide. Reading the room to optimize roster construction is still paramount.
At the beginning, it was stated that valuation shouldn’t be thought of in absolute but rather relative terms. It’s not that a $25 player is worth $25 and a $24 player is worth $24. It’s that’s in a vacuum, the $25 guy contributes a little more than the $24 guy. Who knows, maybe the contributions of the $24 player are more useful based on your team construct. Still, the better the relative ranks, the better your basis for making decisions.
Here’s an example of a logical category adjustment based on the data presented for the NFBC Main Event content. It was already demonstrated that taking $3 from steals and giving to homers results in three more points so let’s start there. The flatness of the batting average curve screams to borrow from Peter to pay Paul, so let’s take $2 and give a buck each to runs and RBI. Lastly, to account for the second and third justifications for CER, let’s grab another buck from steals and award it to homers. Keeping in mind the starting point is $35.88 for each, the final dollars per category are:
| HR | RBI | SB | BA | R |
| $39.88 | $36.88 | $31.88 | $33.88 | $36.88 |
My value calculator allows customization of the category weights. The default is 1 for all five, which was used to generate the PVM earnings presented earlier. Converting the adjusted budget distribution to category weight yields:
| HR | RBI | SB | BA | R |
| 1.11 | 1.03 | 0.89 | 0.94 | 1.03 |
Plugging those coefficients into the value calculator renders CER earnings, displayed with those already shared:
| PVM | SGP | SD | CER | |
| Mookie Betts | $43 | $41 | $42 | $43 |
| Jose Altuve | $41 | $38 | $40 | $41 |
| Mike Trout | $40 | $39 | $39 | $40 |
| Jonathan Villar | $39 | $34 | $31 | $36 |
| Paul Goldschmidt | $34 | $33 | $32 | $34 |
| Jean Segura | $34 | $30 | $31 | $33 |
| Charlie Blackmon | $33 | $31 | $33 | $33 |
| Nolan Arenado | $32 | $35 | $35 | $34 |
| Kris Bryant | $31 | $32 | $32 | $32 |
| Brian Dozier | $30 | $31 | $29 | $30 |
Villar is still higher with CER but he deserves it, in a vacuum steals are extremely valuable. Sure, we can empirically adjust the category coefficients to match SGP, but why not just use SGP? From where I sit, being guided by the better PVM process, then monitoring team construct is the best of both worlds. The impact of Villar, and other speedsters, is softened, but not mitigated. This seems fair.
With respect to Arenado, and other sluggers, their value is poked up to almost match SGP and SD. Understanding the imperfection of projections and valuation theory while keeping in mind we’re talking about relative and not absolute rankings, the CER adjustment is plenty convincing to go the extra buck or two so you aren’t devoid of ample power. The kicker is if you’re bidding against others using PVM, you may split the difference and not have to bid the full CER increase.
Well friends, there you have it, the case for CER, part objective, part subjective. While some may be wary of the subjectivity, that’s the beauty of it. It’s not a one-size-fits-all entity. Some need more of a push than others. Different leagues have different characteristics, especially those of the long-standing variety with established trends. Combining the advantage CER offers along with your expertise is a surefire recipe for success. Let’s swap victory stories in the winner’s circle!